53 Data: Liberating data with Tabula
Purpose: Sometimes data are messy—we know how to deal with that. Other times data are “locked up” in a format we can’t easily analyze, such as in a PDF. In this exercise you’ll learn how to liberate data from a PDF table using Tabula.
Reading: (None, this exercise is the reading.)
## ── Attaching core tidyverse packages ──────────────────────── tidyverse 2.0.0 ──
## ✔ dplyr     1.1.4     ✔ readr     2.1.5
## ✔ forcats   1.0.0     ✔ stringr   1.5.1
## ✔ ggplot2   3.5.2     ✔ tibble    3.2.1
## ✔ lubridate 1.9.4     ✔ tidyr     1.3.1
## ✔ purrr     1.0.4
## ── Conflicts ────────────────────────────────────────── tidyverse_conflicts() ──
## ✖ dplyr::filter() masks stats::filter()
## ✖ dplyr::lag()    masks stats::lag()
## ℹ Use the conflicted package (<http://conflicted.r-lib.org/>) to force all conflicts to become errorsBackground: Tabula is a piece of software developed for journalists carrying out investigative reporting. It was developed with support from organizations like ProPublica and The New York Times. This tool is meant to help investigators parse unwieldy PDFs and liberate useful information.
53.1 Setup
53.1.1 q1 Install Tabula.
Download and install Tabula; the webpage has installation instructions.
Note: Tabula’s interface is through a locally-hosted server; it should automatically open a browser window for Tabula. If it does not, then open http://localhost:8080/ after you’ve launched Tabula.
53.2 Liberating Data
53.2.1 q2.1 Obtain the data.
Download FY2019 independent financial audit report (PDF) from the Needham, MA financial reports page.
53.2.2 q2.2 Try it the hard way.
Try copy-pasting from the FY2019 report the table Government-Wide Financial Analysis into a text document or your favorite spreadsheet editor. This is unlikely to produce the desired result. (Please don’t spend any time trying to format this copied data—you’re about to learn a better way!)
Tabula is a tool that will help us liberate the data; basically, it’s a copy-paste for PDF tables that actually works.
53.2.3 q3 Extract from the FY2019 report the Government-Wide Financial Analysis table.
We’ll do this in steps:
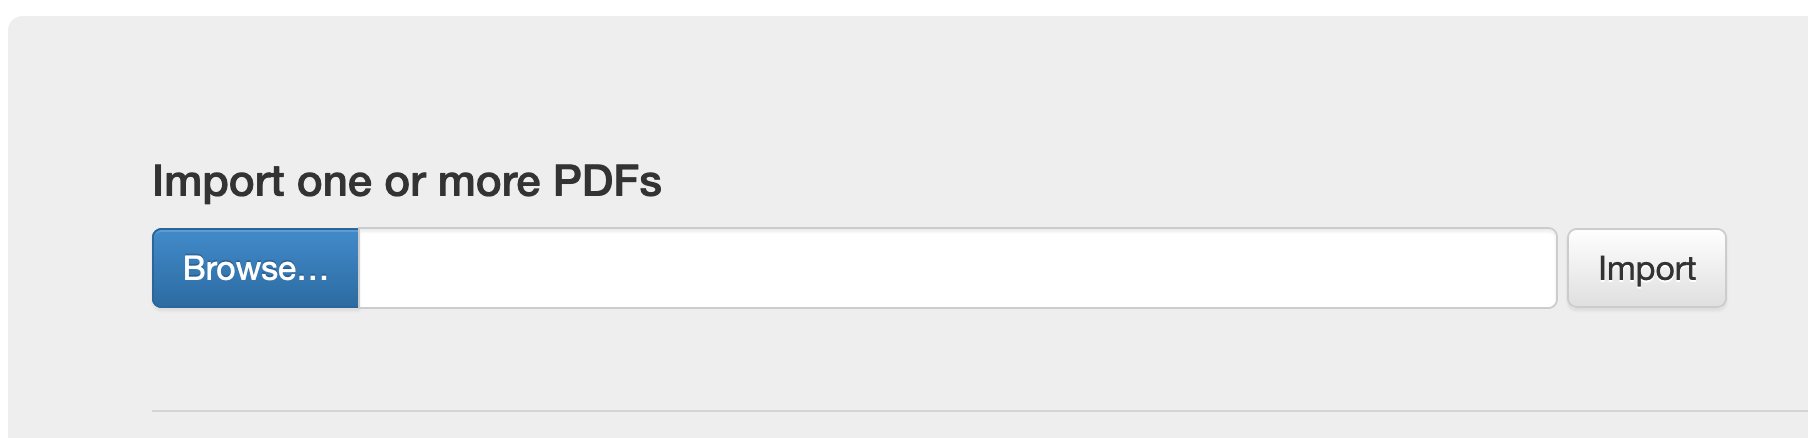
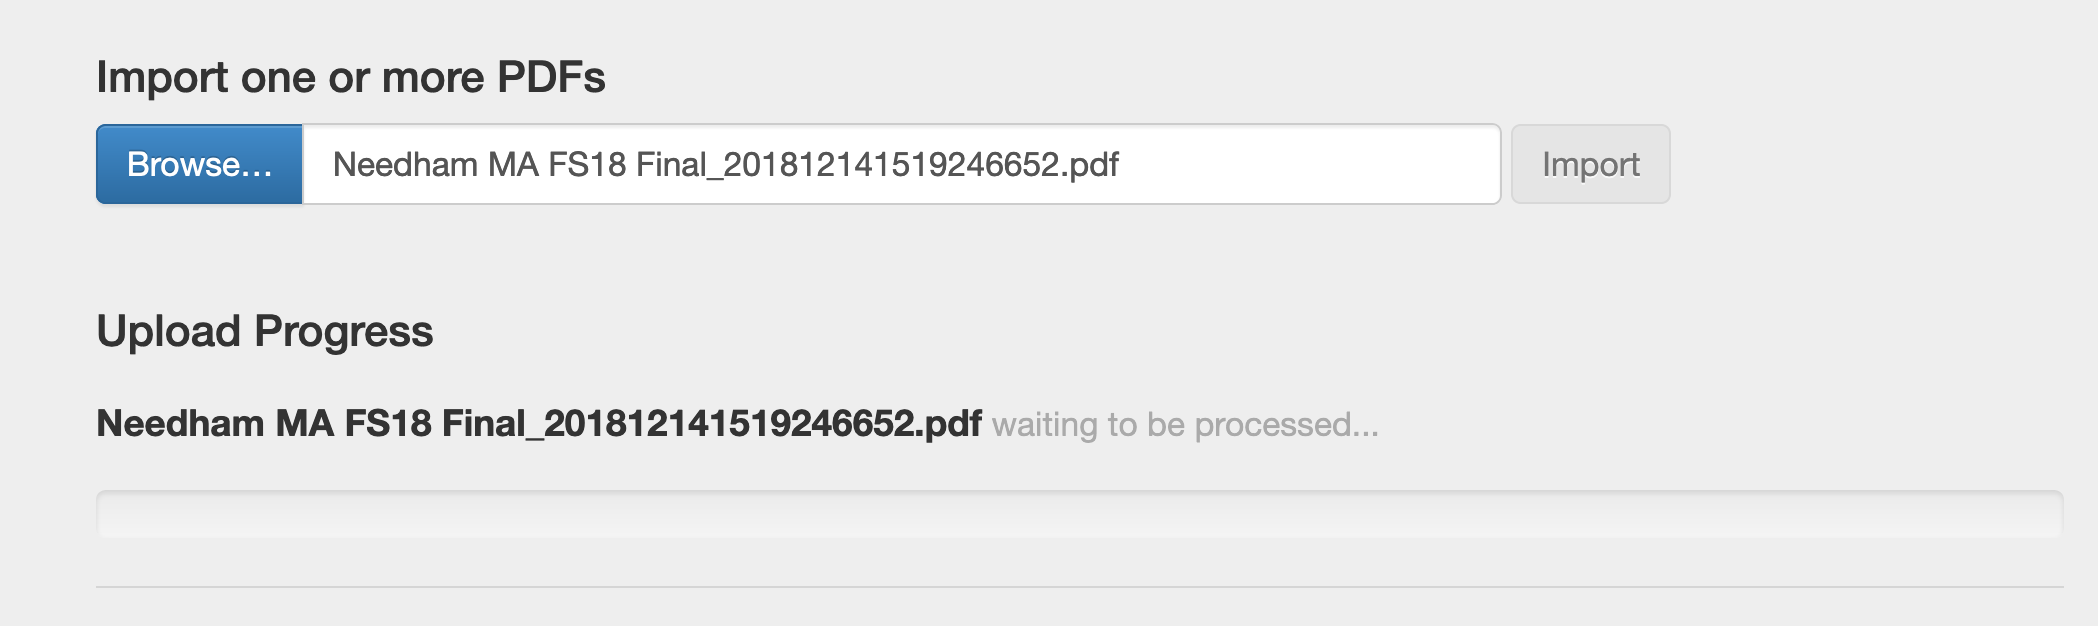
- Click the browse button to select your downloaded FY2019 report and click Import.
- Wait for the file to finish processing; this takes about 2 minutes on my laptop.
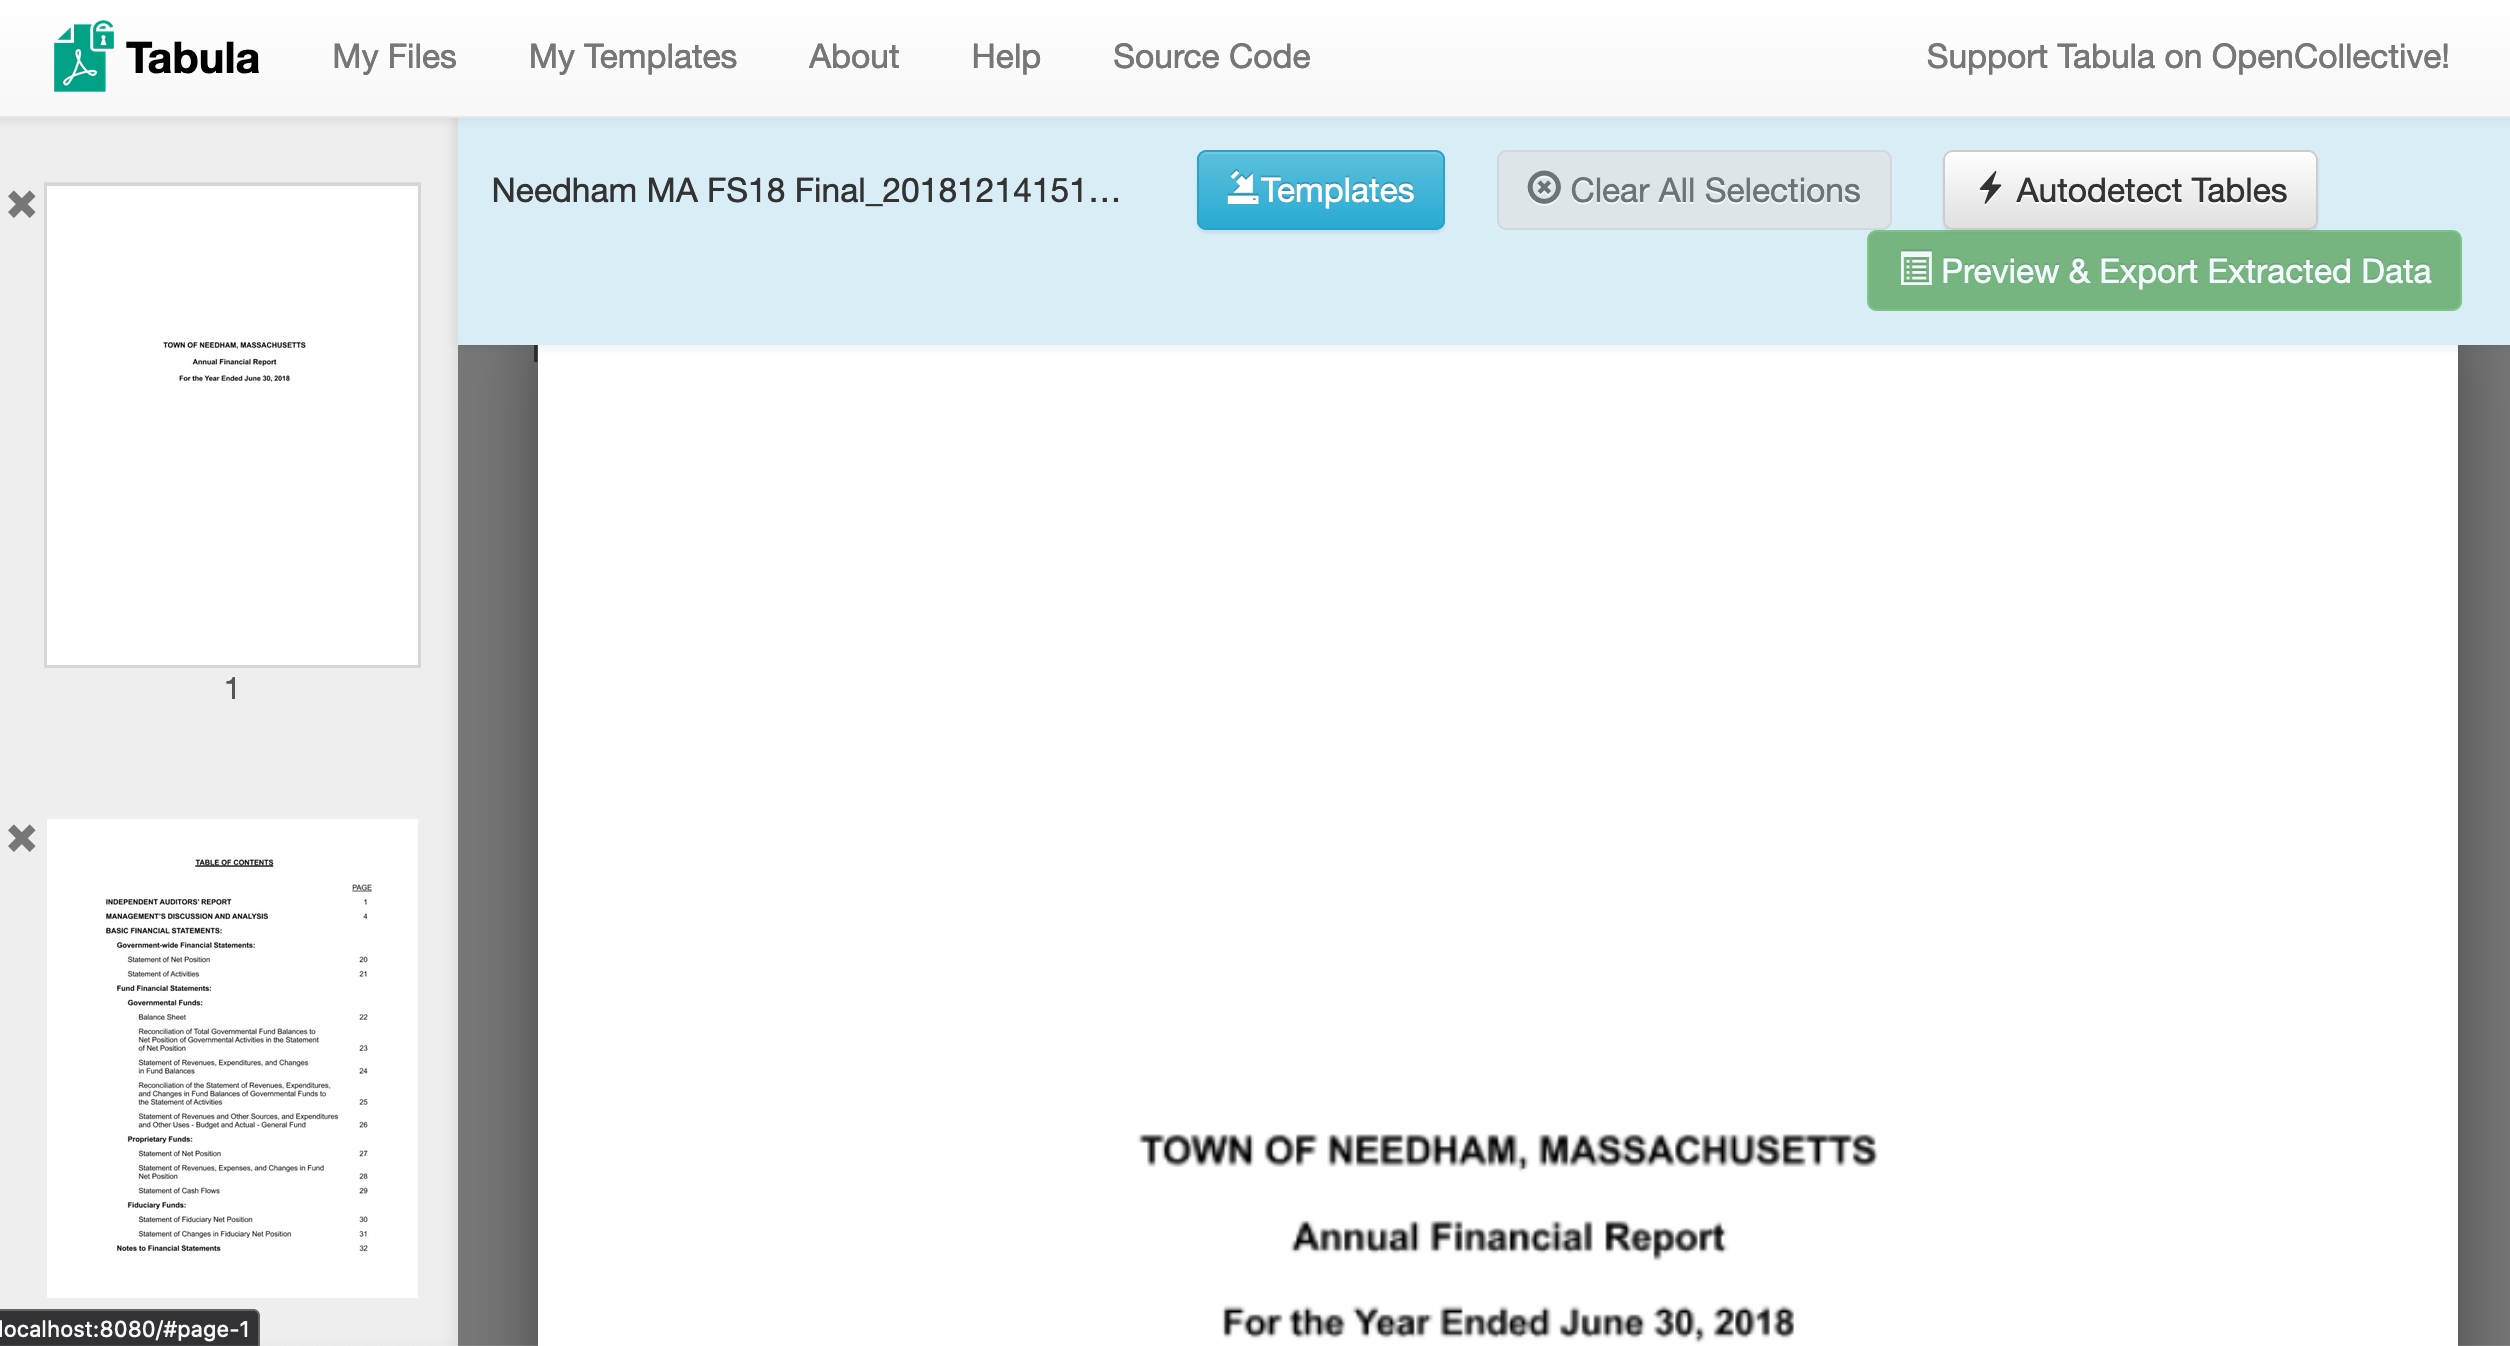
- Once Tabula has imported the file, your view will switch to a view of the PDF.
- Scroll to the
Government-Wide Financial Analysistable; click and drag to select the data. Click Preview & Export Extracted Data.
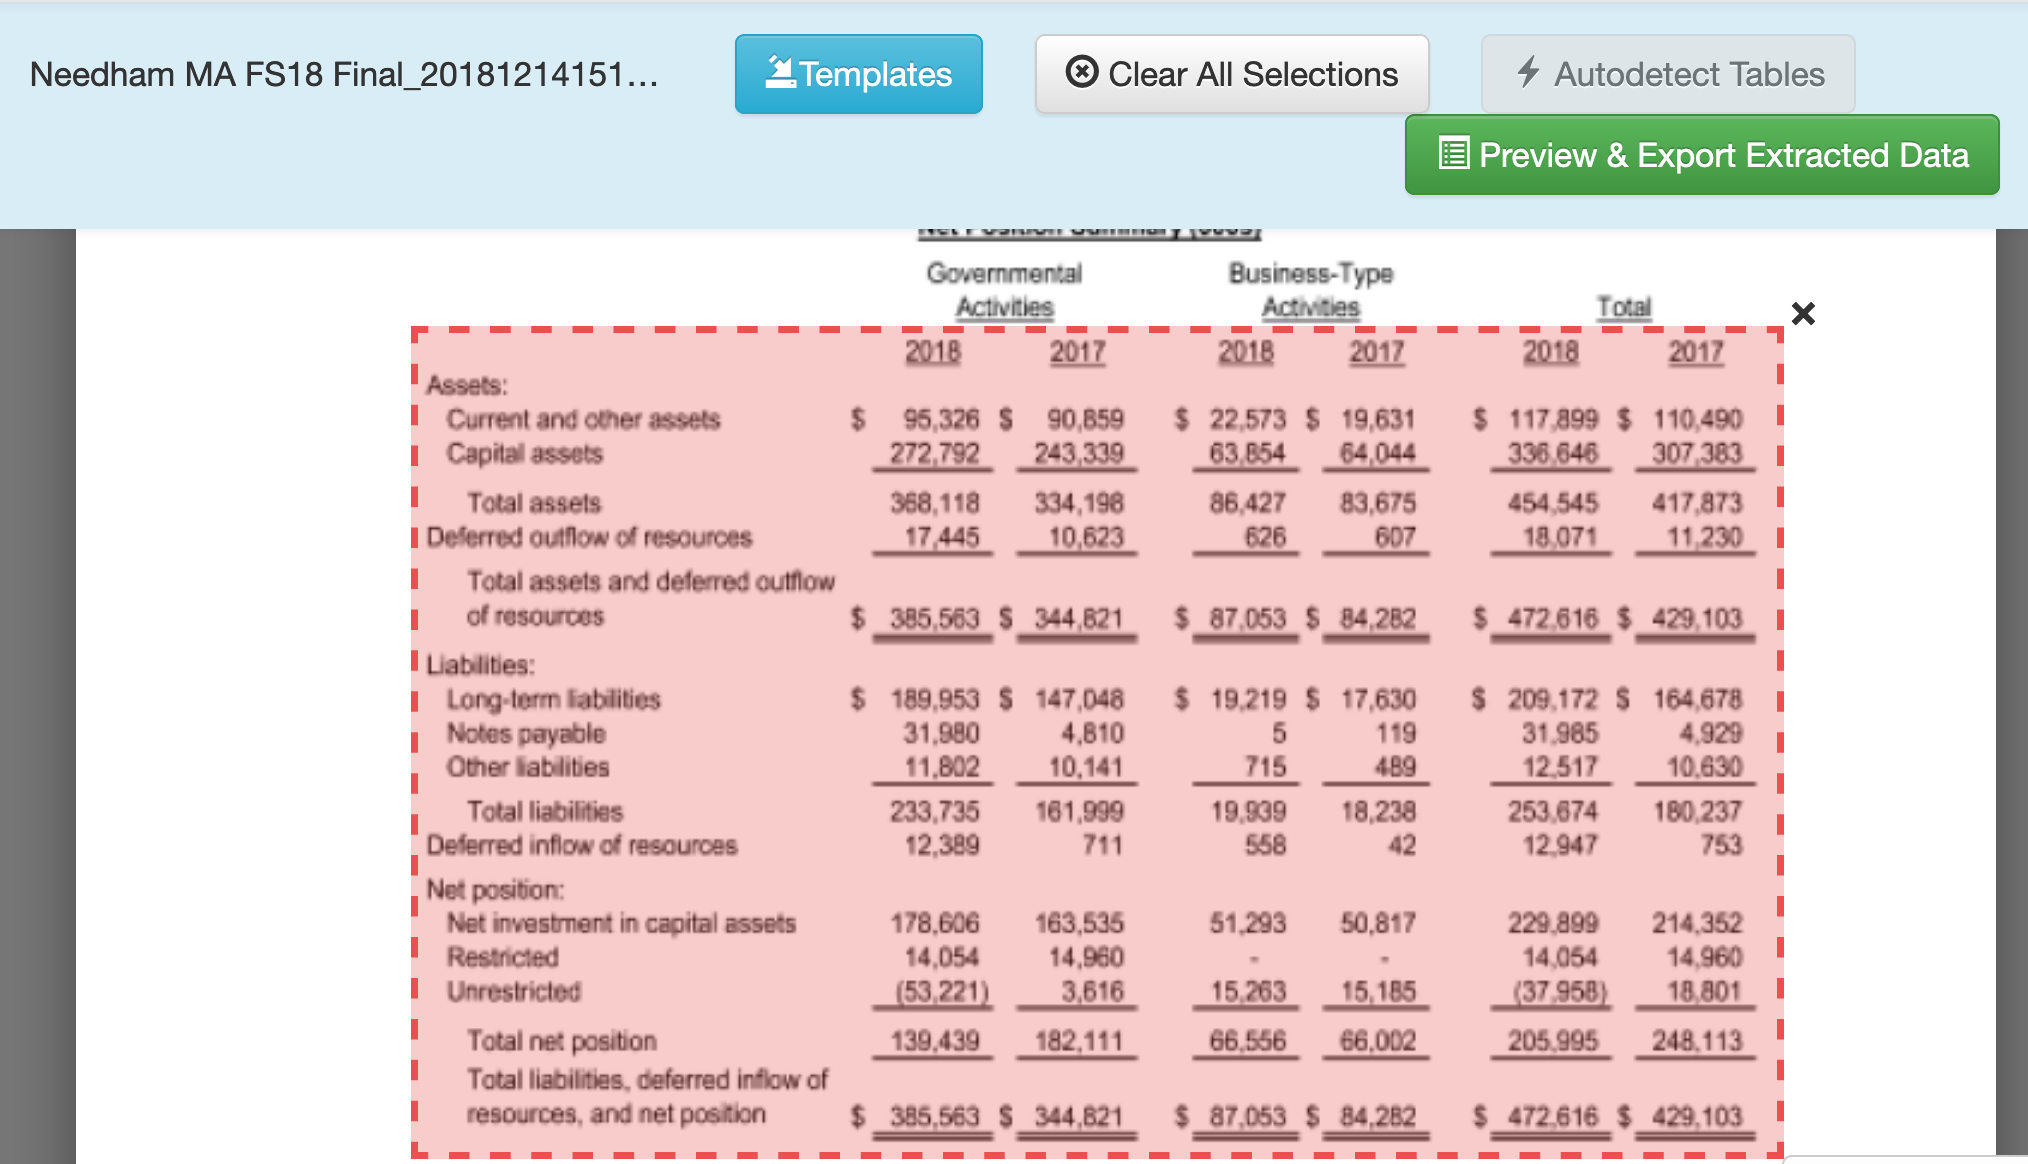
- You will arrive at a preview of the extracted data. You may find that Tabula has merged some of the columns; if this happens click the Revise selection(s) button to go back and adjust your selection.
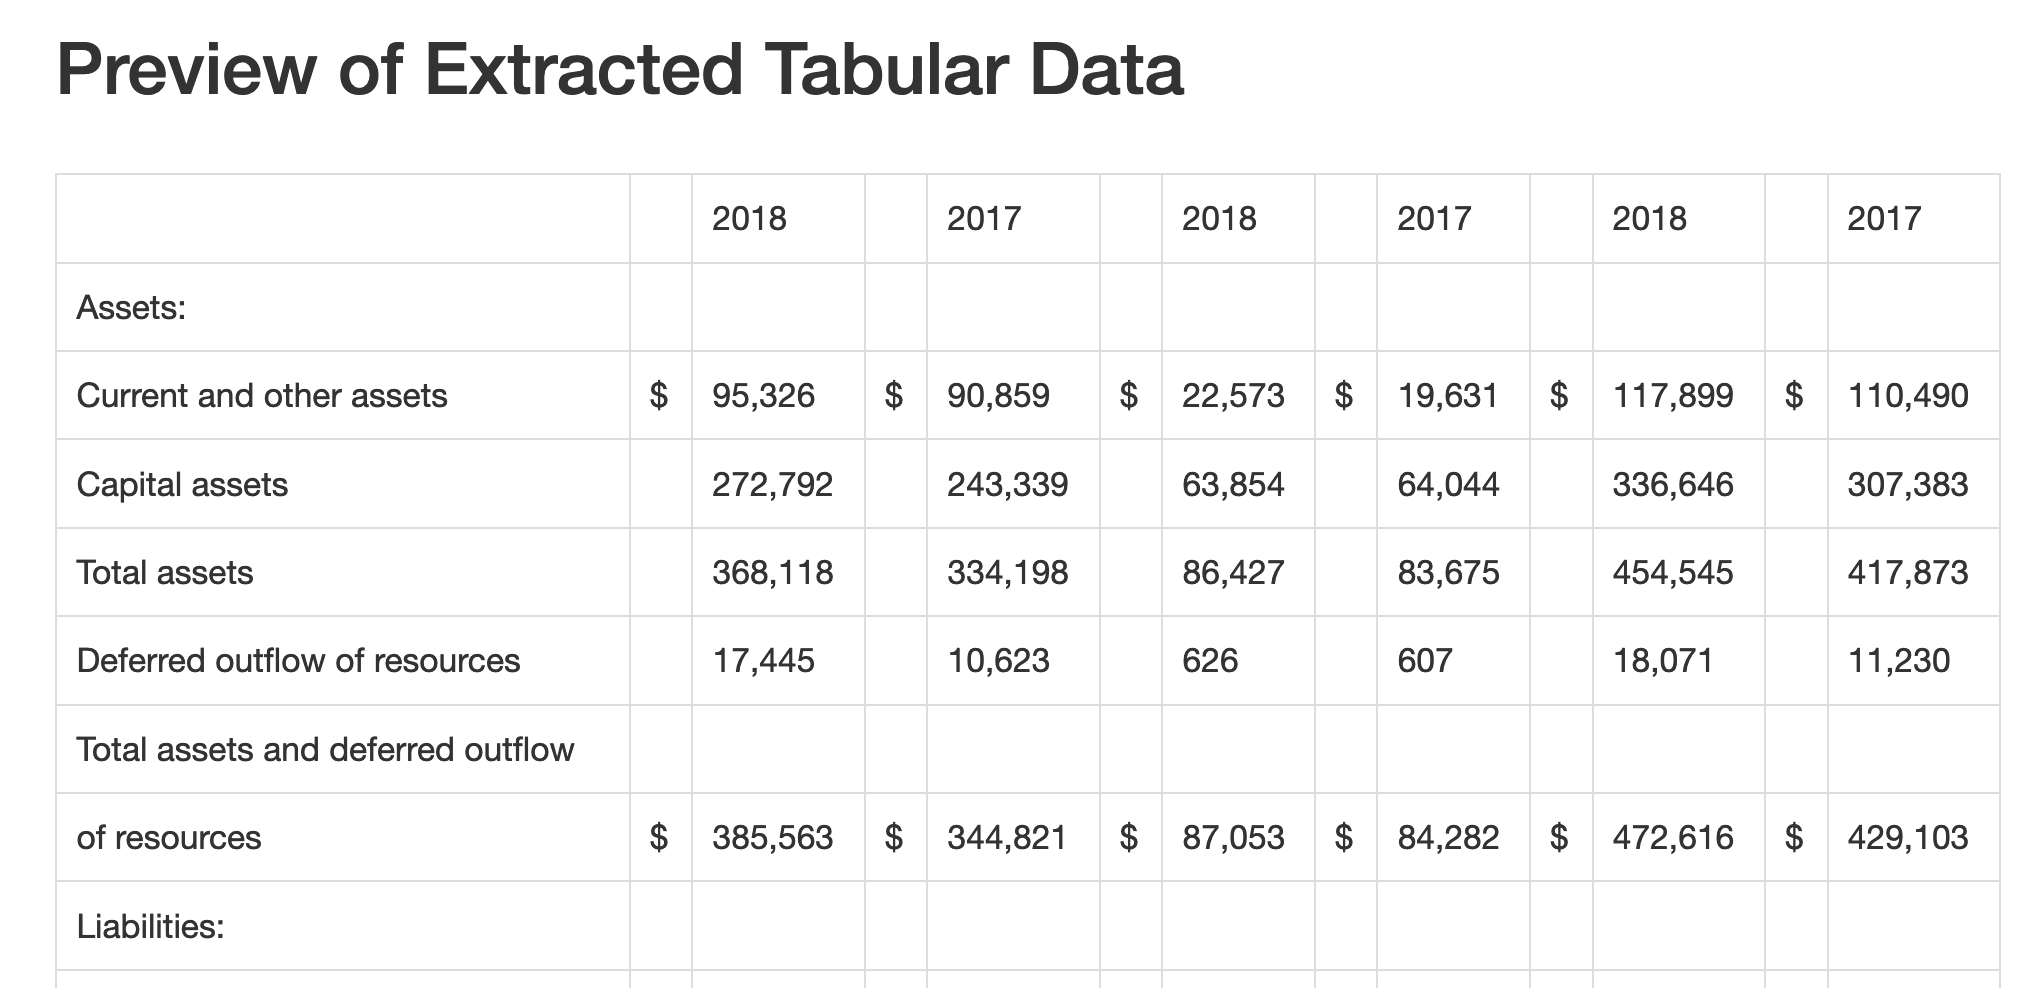
- Once you have a preview that matches the columns above, select the CSV filetype and click the Export button. Download the file to your
datafolder and give it a sensible filename.
53.2.4 q4 Load and clean the data.
Load and clean the table you extracted above. Use the column names category and [government|business|total]_[2019|2018]. Do not tidy (pivot) the data yet, but make sure the appropriate columns are numeric.
Note: In accounting practice, numbers in parentheses are understood to be negative, e.g. (1000) = -1000.
df_2019_raw <- read_csv(
  "./data/needham_fs19.csv",
  skip = 1,
  col_names = c(
    "category",
    "X2",
    "governmental_2019",
    "X4",
    "governmental_2018",
    "X6",
    "business_2019",
    "X8",
    "business_2018",
    "X10",
    "total_2019",
    "X12",
    "total_2018"
  )
)

df_2019 <-
  df_2019_raw %>%
  select(-contains("X")) %>%
  ## across() allows us to apply the same mutation to multiple
  ## columns; remove all internal spaces from numbers
  mutate(across(-category, ~str_remove_all(., "\\s"))) %>%
  ## Handle numbers enclosed by parentheses; make them negative
  ## and remove all parentheses for the number parser
  mutate(across(
    -category,
    ~if_else(
      str_detect(., "\\("),
      str_c("-", str_remove_all(., "[\\(\\)]")),
      str_remove_all(., "[\\(\\)]")
    )
  )) %>%
  ## Use the number parser to handle conversions
  mutate(across(-category, parse_number)) %>%
  ## Fix a couple chopped lines
  mutate(
    category = if_else(
      category == "resources",
      "Total assets and deferred outflow of resources",
      category
    )
  ) %>%
  mutate(
    category = str_replace(
      category,
      "resources, and net position",
      "Total liabilities, deferred inflow of resources, and net position"
    )
  ) %>%
  filter(!is.na(governmental_2019))
df_2019 %>% glimpse()
Use the following to check your work:
## NOTE: No need to edit; check a couple problematic values
assertthat::assert_that(
  (
    df_2019 %>%
    filter(category == "Deferred outflow of resources") %>%
    pull(business_2019)
  ) == 1160
)

assertthat::assert_that(
  (
    df_2019 %>%
    filter(category == "Unrestricted") %>%
    pull(governmental_2019)
  ) == -62396
)

print("Excellent!")
Where Tabula really shines is in cases where you need to process many documents; if you find yourself needing to process a whole folder of PDF’s, consider using Tabula.