31 Communication: Narrative Basics
Purpose: The point of data science is not to gather a random pile of facts; it’s to do something with those facts. One of our key goals in data science is to help drive decisions and action—we accomplish this by communicating our data story. Since story is fundamentally an exercise in narrative, we’ll start our data story training with some narrative basics.
Reading: Randy Olson’s TED Talk, introducing the And, But, Therefore (ABT) framework. Reading Time: ~ 10 minutes
Lesson Plan: Ensure all students submit their narrative spectrum classifications and justification through the Google Form. Set aside a full-class meeting to discuss the student results. Visualize the results, and see what (if any) consensus the class came to. Ask a few students who classified the graphs differently to share their perspective. After gathering student input, offer your own perspective on the graph. Repeat for each example.
Make sure to emphasize that different people will read graphs differently; we don’t have complete control over the narrative when presenting a graph. But the simpler and more focused our graph, the better control we have over the narrative experienced. (TODO: Future exercises/activities should emphasize this!)
31.1 Exposition
Scientist-turned-storyteller Randy Olson[1] introduced the narrative spectrum. Three points along the spectrum are listed below:
| TLA | Framework | Narrative Spectrum |
|---|---|---|
| AAA | And, And, And | Non-narrative |
| ABT | And, But, Therefore | Just right! |
| DHY | Despite, However, Yet | Overly-narrative |
The narrative spectrum runs from non-narrative: introducing no conflict or tension, to overly-narrative: introducing too many conflicting ideas. Olson observed that the middle of the narrative spectrum is just the right amount of narrative content. The extreme points tend to be boring:
- A child may tell a story like “We went to the store, AND the man had a hat, AND I lost a shoe, AND we went home.” This story lacks any narrative content: no part of the story relates to any other part, so no conflict or drama can arise. (AAA)
- An extremely learned professor may tell a story like “Kolmogorov proposed a 5/3 power law. HOWEVER Smith found 3/8 power law behavior. YET Chandrasekhar discovered a 2/3 power law….” This story swings in the opposite direction; there is too much conflict, and most listeners will be totally lost. This is the proverbial random pile of facts we need to avoid when communicating. (DHY)
Using the ABT framework can help us get started with framing a story. For example:
“Data science is the use of computation and statistics to learn from data AND we want to use data science to help people make decisions BUT a random pile of facts will lose our audience THEREFORE we will study narrative to help tell our data story.”
The AND part of the framework is our exposition; every story needs some setup. The BUT part introduces some conflict—in a hollywood story this could be a murder, but in science it could be an unexplained phenomenon. THEREFORE is where we pay off the exposition and conflict. In our hollywood story its where we solve the murder. In science its where we learn something about reality, and pose the next exciting question to investigate.
Note: The ABT framework is not the only way to tell a story. It is a simplified framework to help us get started!
31.2 Exercises: Judging Narrative Content
Now let’s put all that narrative theory to use! We’re going to judge a number of graphs based on their narrative content, placing them at a point on Olson’s narrative spectrum. To do so, we’re going to need some framing for the following exercise:
For this exercise, pretend that you are going to show the following graphs to a very busy data scientist.
The following graphs are not intended for you to use to discover things. They are intended to communicate your findings to someone else. Your data science colleague is smart and competent (she knows what a boxplot is, understands variability, etc.), but she’s also busy. You need to present a figure that tells a story quickly, or she’s going to use her limited time to think about something else.
Your task: Study the following graphs and determine the closest point—AAA, ABT, or DHY—near which the example lies on narrative spectrum. Keep in mind your intended audience (your colleague) when judging how much or how little narrative content is present.
## ── Attaching core tidyverse packages ──────────────────────── tidyverse 2.0.0 ──
## ✔ dplyr     1.1.4     ✔ readr     2.1.5
## ✔ forcats   1.0.0     ✔ stringr   1.5.1
## ✔ ggplot2   3.5.2     ✔ tibble    3.2.1
## ✔ lubridate 1.9.4     ✔ tidyr     1.3.1
## ✔ purrr     1.0.4
## ── Conflicts ────────────────────────────────────────── tidyverse_conflicts() ──
## ✖ dplyr::filter() masks stats::filter()
## ✖ dplyr::lag()    masks stats::lag()
## ℹ Use the conflicted package (<http://conflicted.r-lib.org/>) to force all conflicts to become errors
31.2.1 q1 Identify the point on the narrative spectrum, and justify your answer.
Hint: Try telling yourself a story based on the graph! This can be your justification for the narrative spectrum point you select.
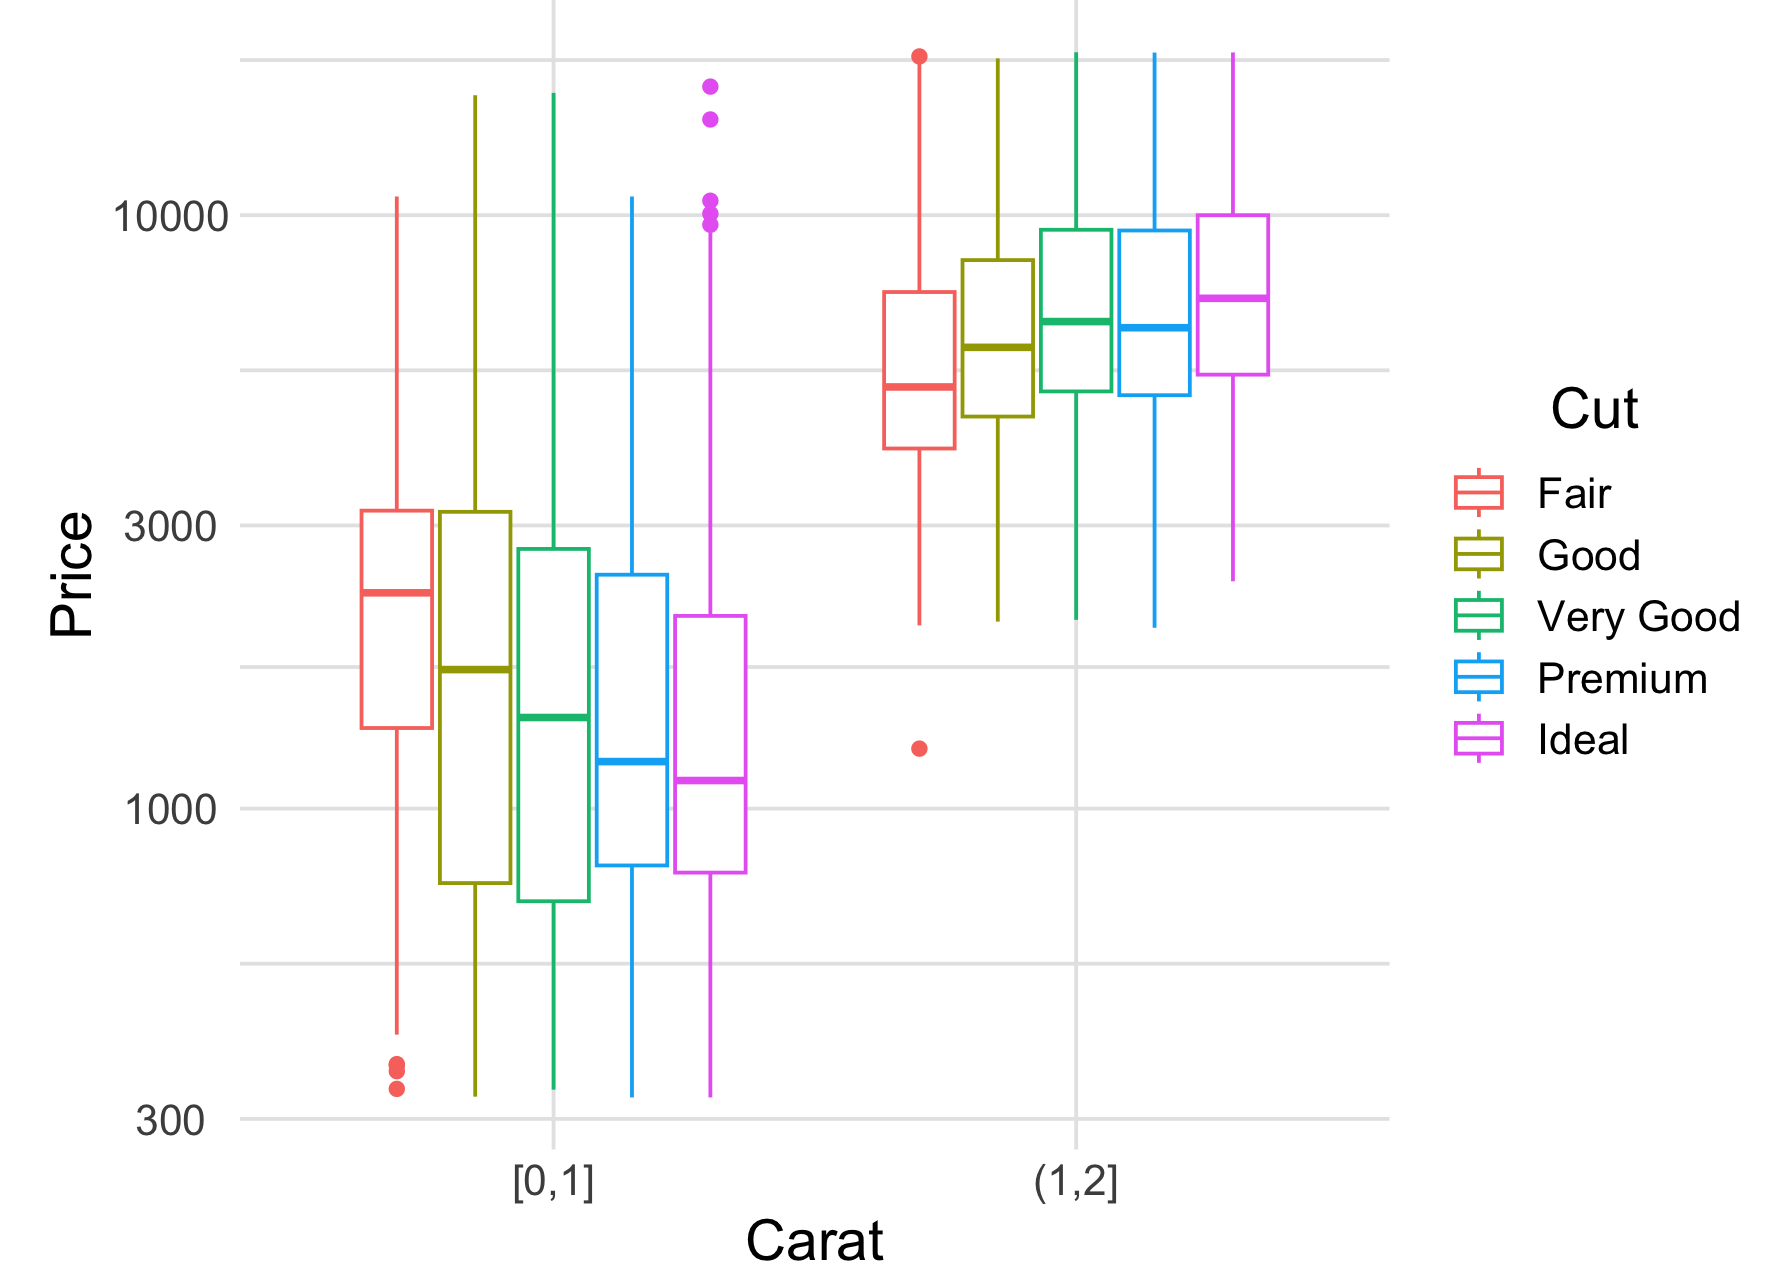
## Saving 7 x 5 in imageClassify: ABT
Justify
At low carat, an improvement in cut tends to decrease price. However,
at a higher carat, an improvement in cut tends to increase price.
This graph conveys a small amount of information, but still manages to
introduce some conflict.
31.2.2 q2 Identify the point on the narrative spectrum, and justify your answer.
## `geom_smooth()` using method = 'gam' and formula = 'y ~ s(x, bs = "cs")'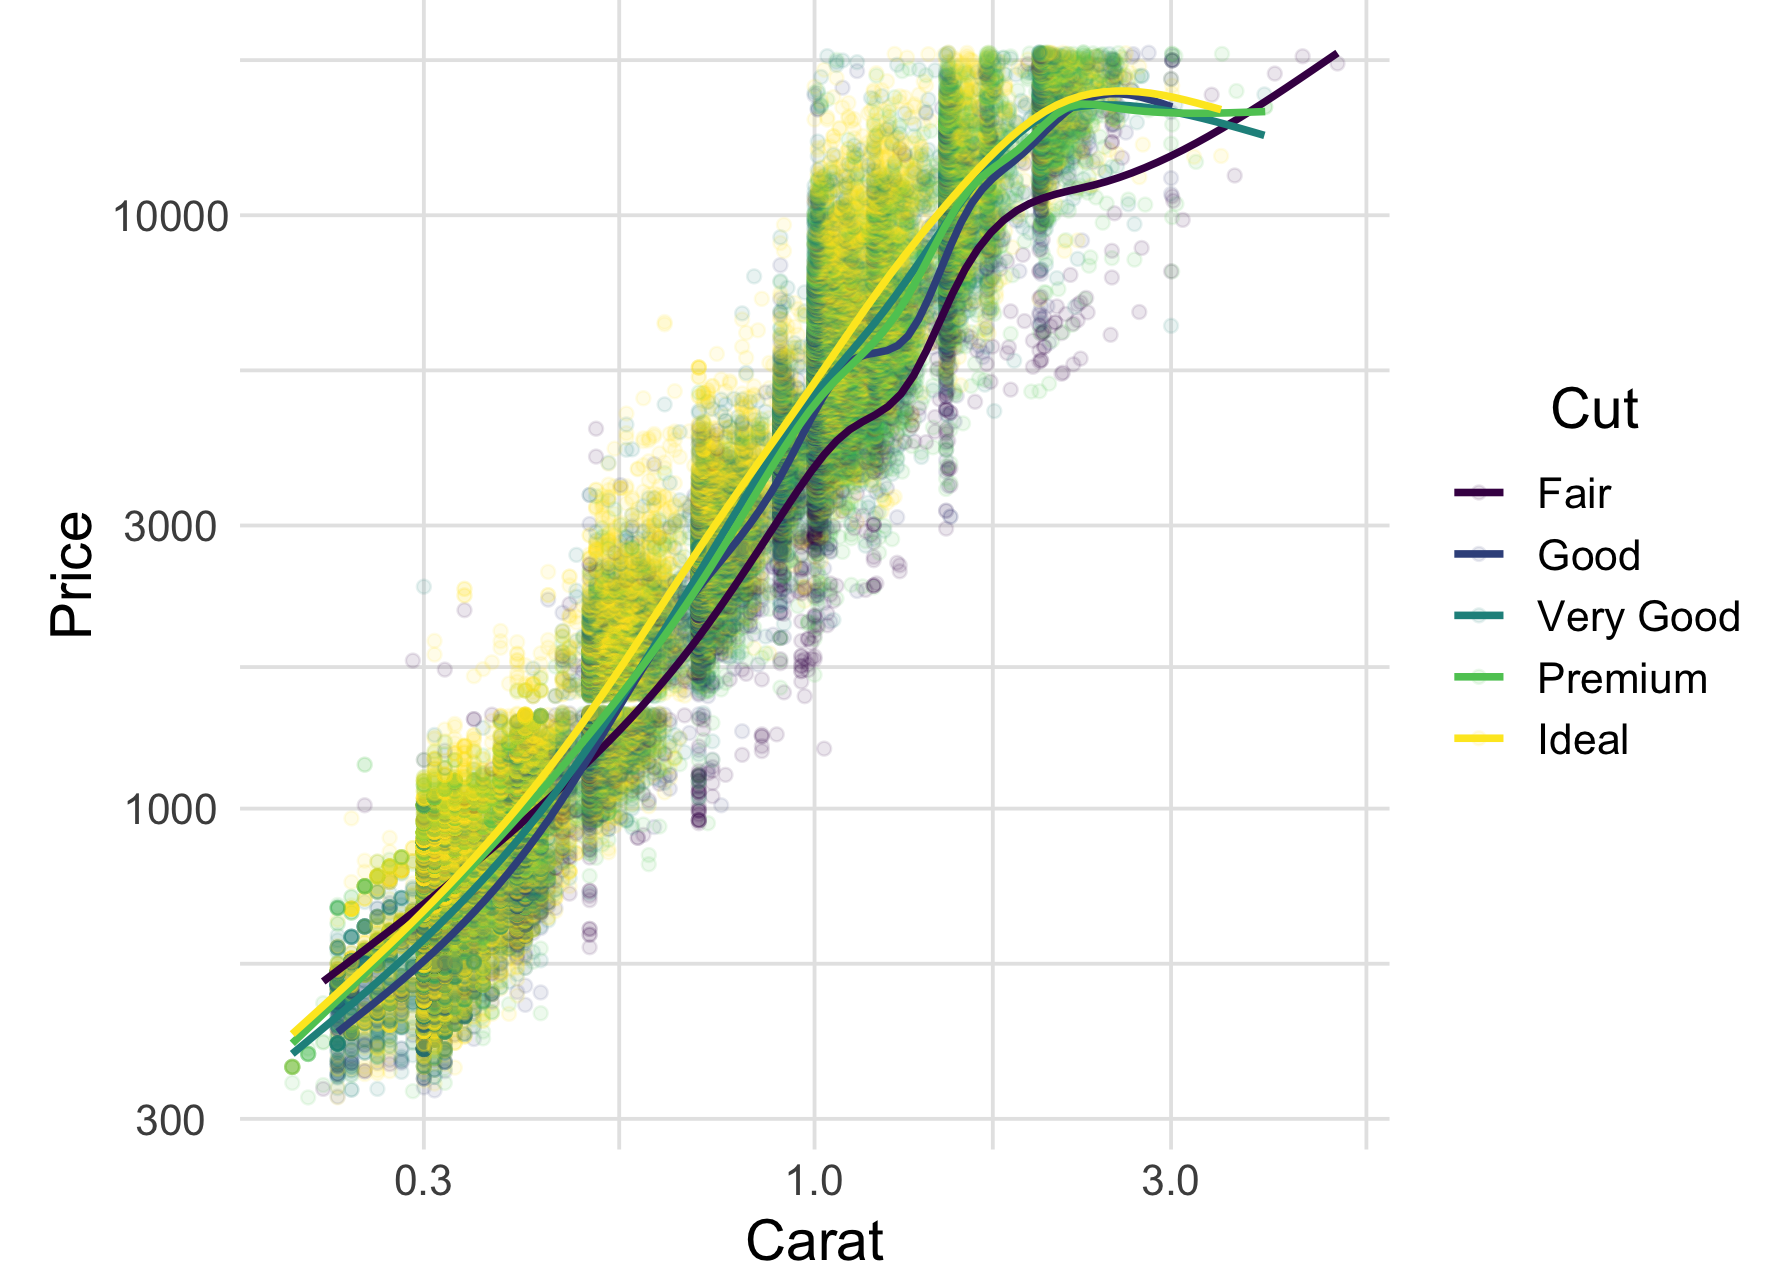
## Saving 7 x 5 in image
## `geom_smooth()` using method = 'gam' and formula = 'y ~ s(x, bs = "cs")'Classify: DHY
Justify
Diamonds tend to be price ordered by their cut. However, at low carat
the Fair diamonds tend to be most pricey. Yet Good, Very Good and
Premium diamonds tend to overlap. There are too many conflicting ideas
in this graph to quickly tell a compelling story.
31.2.3 q3 Identify the point on the narrative spectrum, and justify your answer.
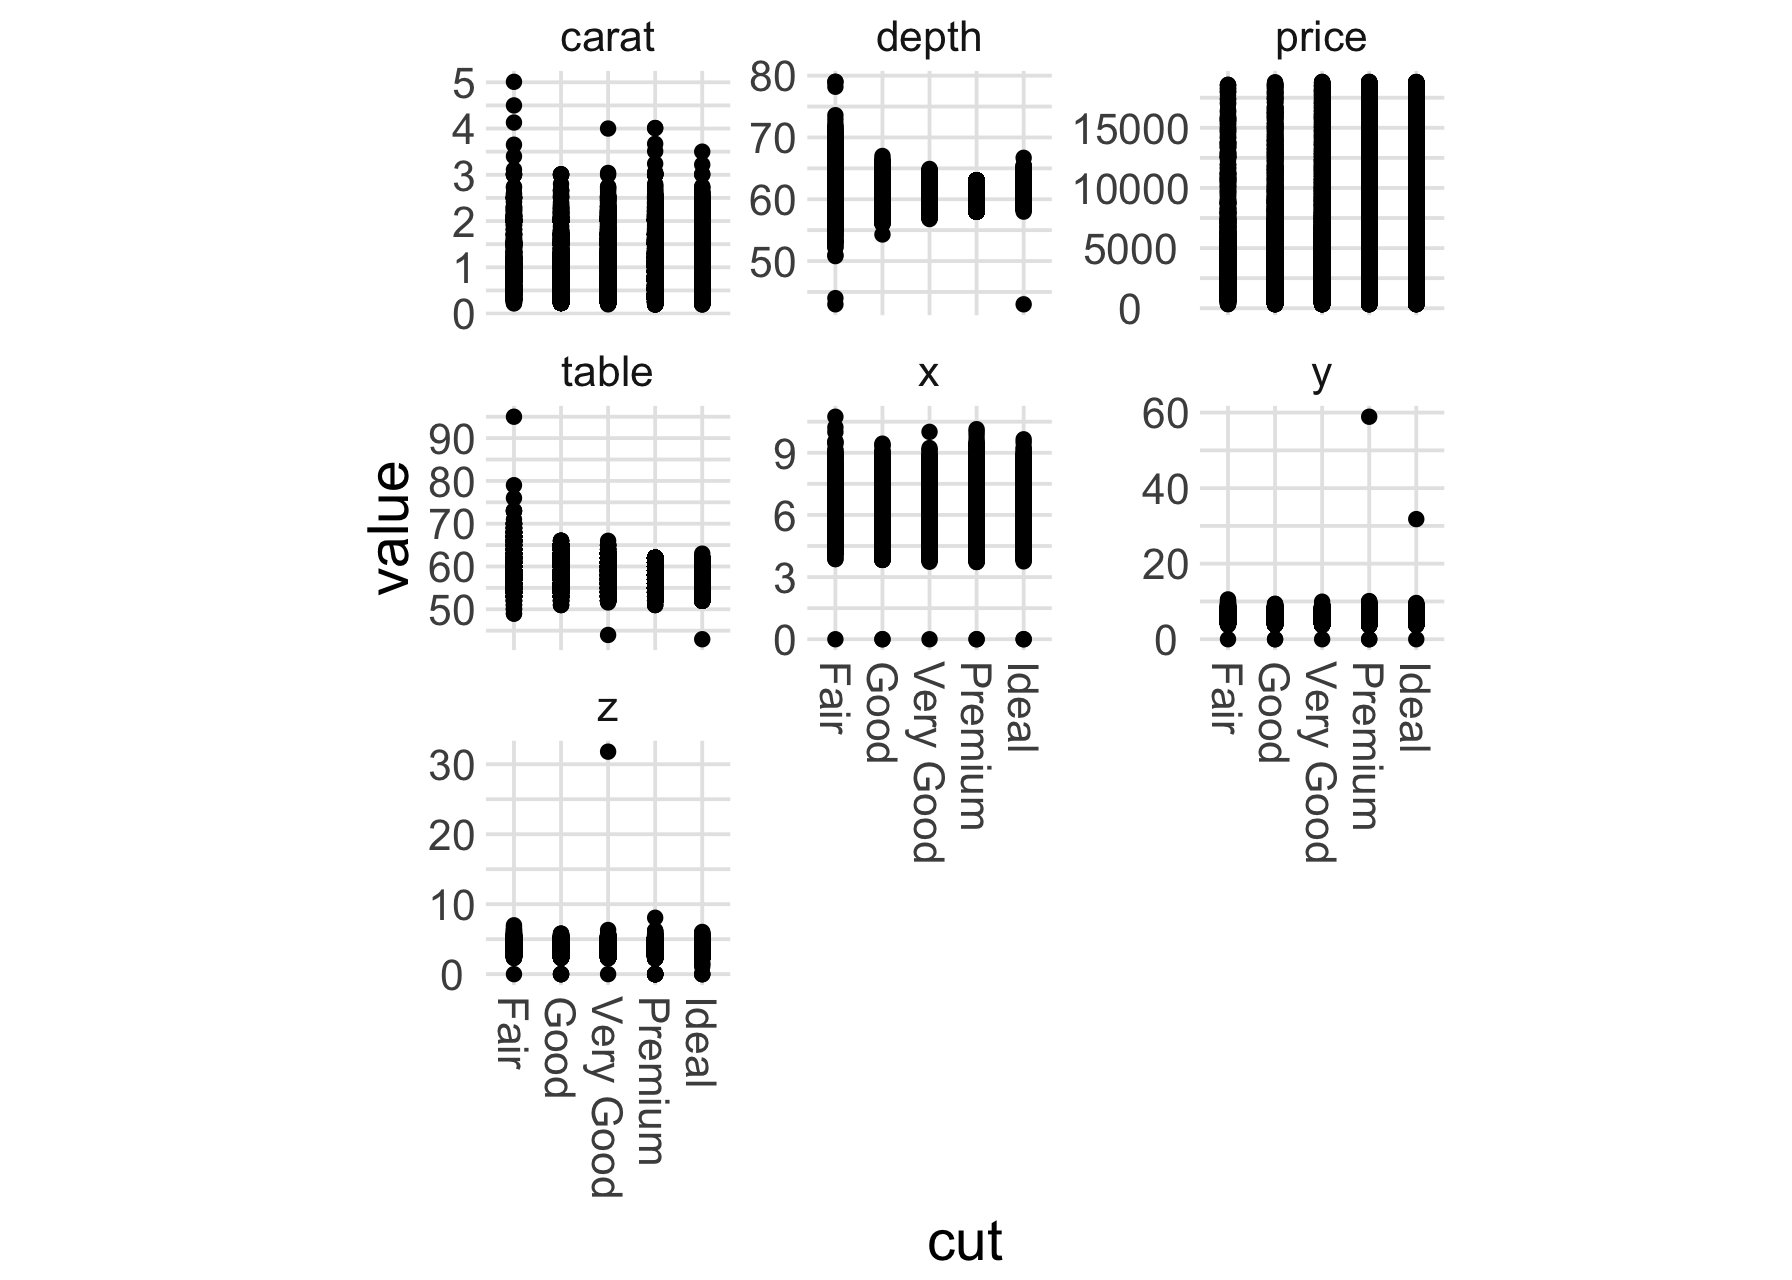
## Saving 7 x 5 in imageClassify: AAA
Justify
The highest carat diamonds tend to be Fair, and Fair diamonds tend
to vary a lot in depth, and price varies widely for all cut values,
and some diamonds have x, y, z values at zero….
31.2.4 q4 Turn in all your answers via google forms. Link
31.3 Bibliography
- [1] Olson, “Houston, We Have a Narrative” (2015)