39 Data: Factors
Purpose: Factors are an important type of variables. Since they’re largely in
a class of their own, there are special tools available in the package forcats
to help wrangle factors.
Reading: (None)
## ── Attaching core tidyverse packages ──────────────────────── tidyverse 2.0.0 ──
## ✔ dplyr     1.1.4     ✔ readr     2.1.5
## ✔ forcats   1.0.0     ✔ stringr   1.5.1
## ✔ ggplot2   3.5.2     ✔ tibble    3.2.1
## ✔ lubridate 1.9.4     ✔ tidyr     1.3.1
## ✔ purrr     1.0.4
## ── Conflicts ────────────────────────────────────────── tidyverse_conflicts() ──
## ✖ dplyr::filter() masks stats::filter()
## ✖ dplyr::lag()    masks stats::lag()
## ℹ Use the conflicted package (<http://conflicted.r-lib.org/>) to force all conflicts to become errorsA factor is a variable that only takes fixed, often non-numeric, values. Factors are sometimes called categorical variables. We’ve already seen
39.1 Organization
39.1.1 q1 The following chunk displays the levels of the factor continent. Run
the following code chunk and note in what order they are listed.
## [1] "Fair" "Good" "Very Good" "Premium" "Ideal"Observations:
- The factor levels are ordered in terms of increasing quality of diamond cut.
- The levels are essentially a measure of quality; we would expect price to (generally) increase with improved cut.
39.1.2 q2 Determine the levels for the continent variable in the gapminder dataset. Note the order of the levels.
## [1] "Africa" "Americas" "Asia" "Europe" "Oceania"Observations:
- The factor levels are ordered alphabetically.
The forcats package has tools for working with
factors. For instance, we can assign manual factor levels with the function
fct_relevel(). This is generally used in a mutate(); for instance mutate(x = fct_relevel(x, "a", "b", "c").
39.1.3 q3 Relevel the continents.
Copy your code from q2 and introduce a mutate using fct_relevel() to reorder continent. Choose which levels to reorder and what order in which to put them. Note how the resulting order is changed when you call levels() at the end of the pipe.
gapminder %>%
  mutate(
    continent = fct_relevel(
      continent,
      "Oceania"
    )
  ) %>%
  pull(continent) %>%
  levels()
## [1] "Oceania" "Africa" "Americas" "Asia" "Europe"Observations:
- Calling
fct_reorder()as I do in the solution brings “Oceania” to the front, but leaves the other factors alone.
39.2 Visual Tricks
When factors do no have any meaningful order, it is generally better to sort them on another variable, rather
mpg %>%
  mutate(manufacturer = fct_reorder(manufacturer, cty)) %>%

  ggplot(aes(manufacturer, cty)) +
  geom_boxplot() +
  coord_flip()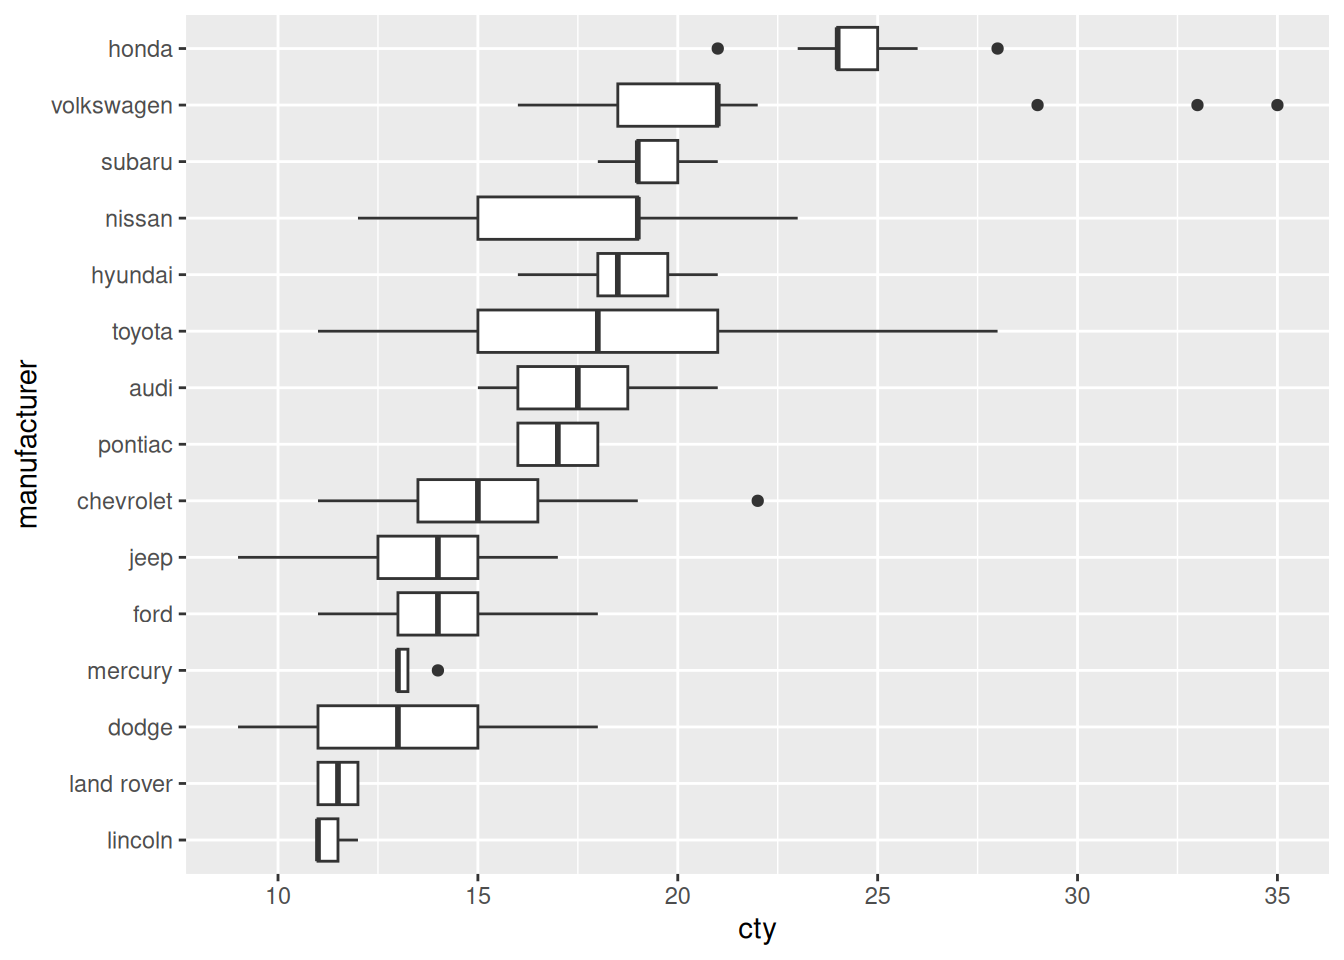
The function fct_reorder(f, x) allows you to reorder the factor f based on
another variable x. This will “match” the order between the two.
39.2.1 q4 Use fct_reorder() to sort manufacturer to match the order of cty.
## TASK: Modify the following code to sort the factor `manufacturer` based on
## `cty`.
mpg %>%
  mutate(manufacturer = fct_reorder(manufacturer, cty)) %>%

  ggplot(aes(manufacturer, cty)) +
  geom_boxplot() +
  coord_flip()
Observations:
Before
- Toyota and Nissan seem have the most variable vehicles in this dataset, in terms of cty.
- Volkswagon has a number of high cty outliers.
Sorted
- Honda has the most efficient vehicles in this sample.
- Lincoln and Land Rover have the least efficient vehicles in this sample.
- Mercury has a remarkably consistent set of cty values; perhaps this is a small sample.
The function fct_reorder2(f, x, y) allows us to sort on two variables; this
is most useful when making line plots.
39.2.2 q5 Sort the countries by values.
Use fct_reorder2() to sort country to match the order of x = year, y = pop. Pay attention to the rightmost edge of the curves and the legend order. How does fct_reorder2() sort factors?
## TASK: Modify the following code to sort the factor `country` based on `year`
## and `pop`.
gapminder %>%
  filter(dense_rank(country) <= 7) %>%
  mutate(country = fct_reorder2(country, year, pop)) %>%

  ggplot(aes(year, pop, color = country)) +
  geom_line() +
  scale_y_log10()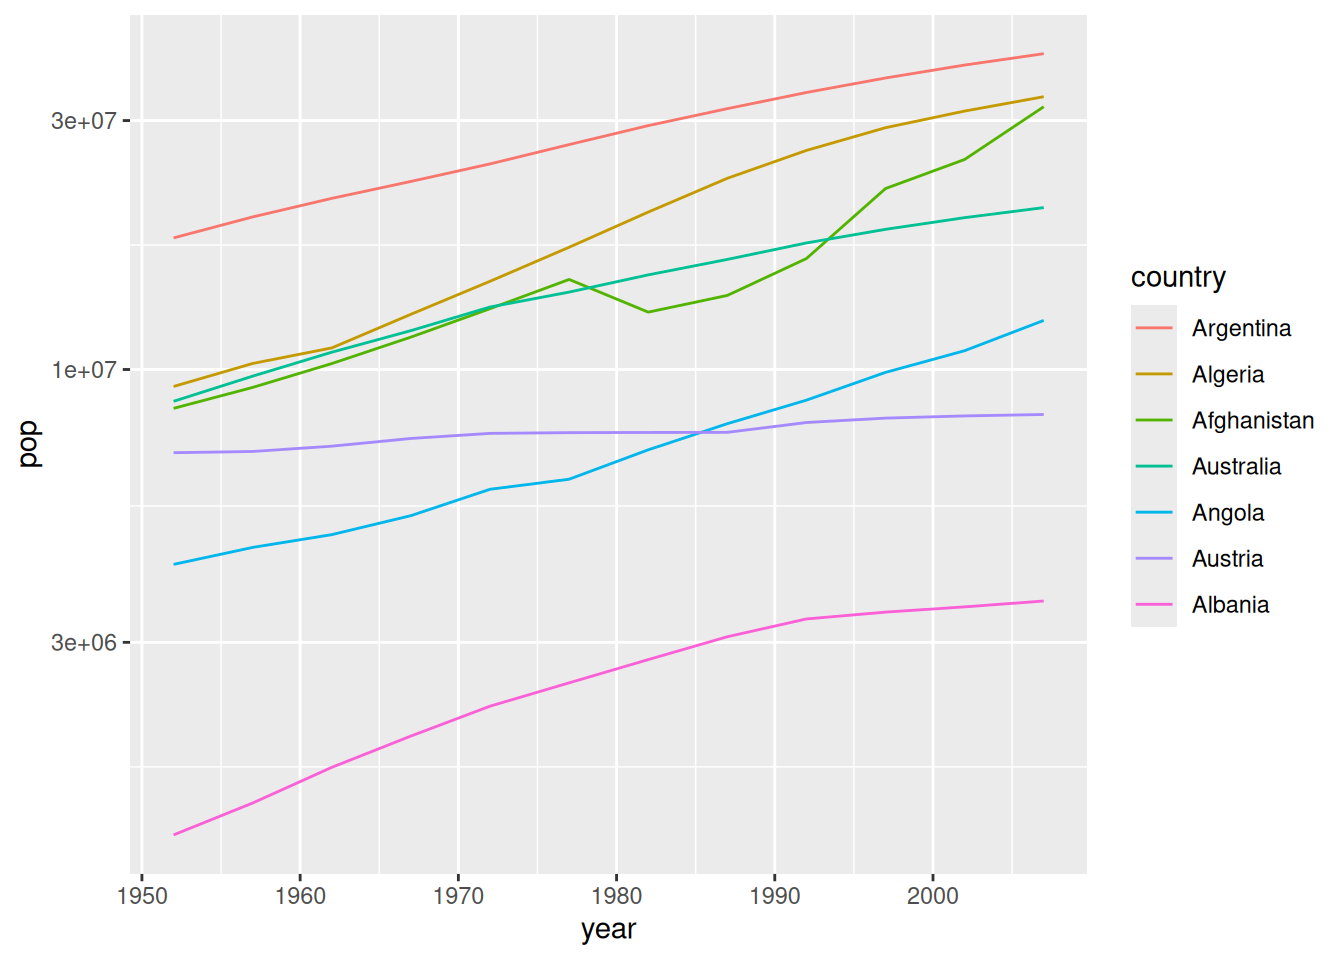
Observations:
- The factors are sorted such that the rightmost points on the lines are vertically ordered the same as the legend.
This small, simple trick is extremely helpful for creating easily-readable line graphs.