Data: Pivoting Data#
Purpose: Data is easiest to use when it is tidy. In fact, grama is specifically designed to use tidy data. But not all data we’ll encounter is tidy! To that end, in this exercise we’ll learn how to tidy our data by pivoting.
As a result of learning how to quickly tidy data, you’ll vastly expand the set of datasets you can analyze. Rather than fighting with data, you’ll be able to quickly wrangle and extract insights.
Setup#
import grama as gr
DF = gr.Intention()
%matplotlib inline

# For assertion
from pandas.api.types import is_integer_dtype
Tidy Data#
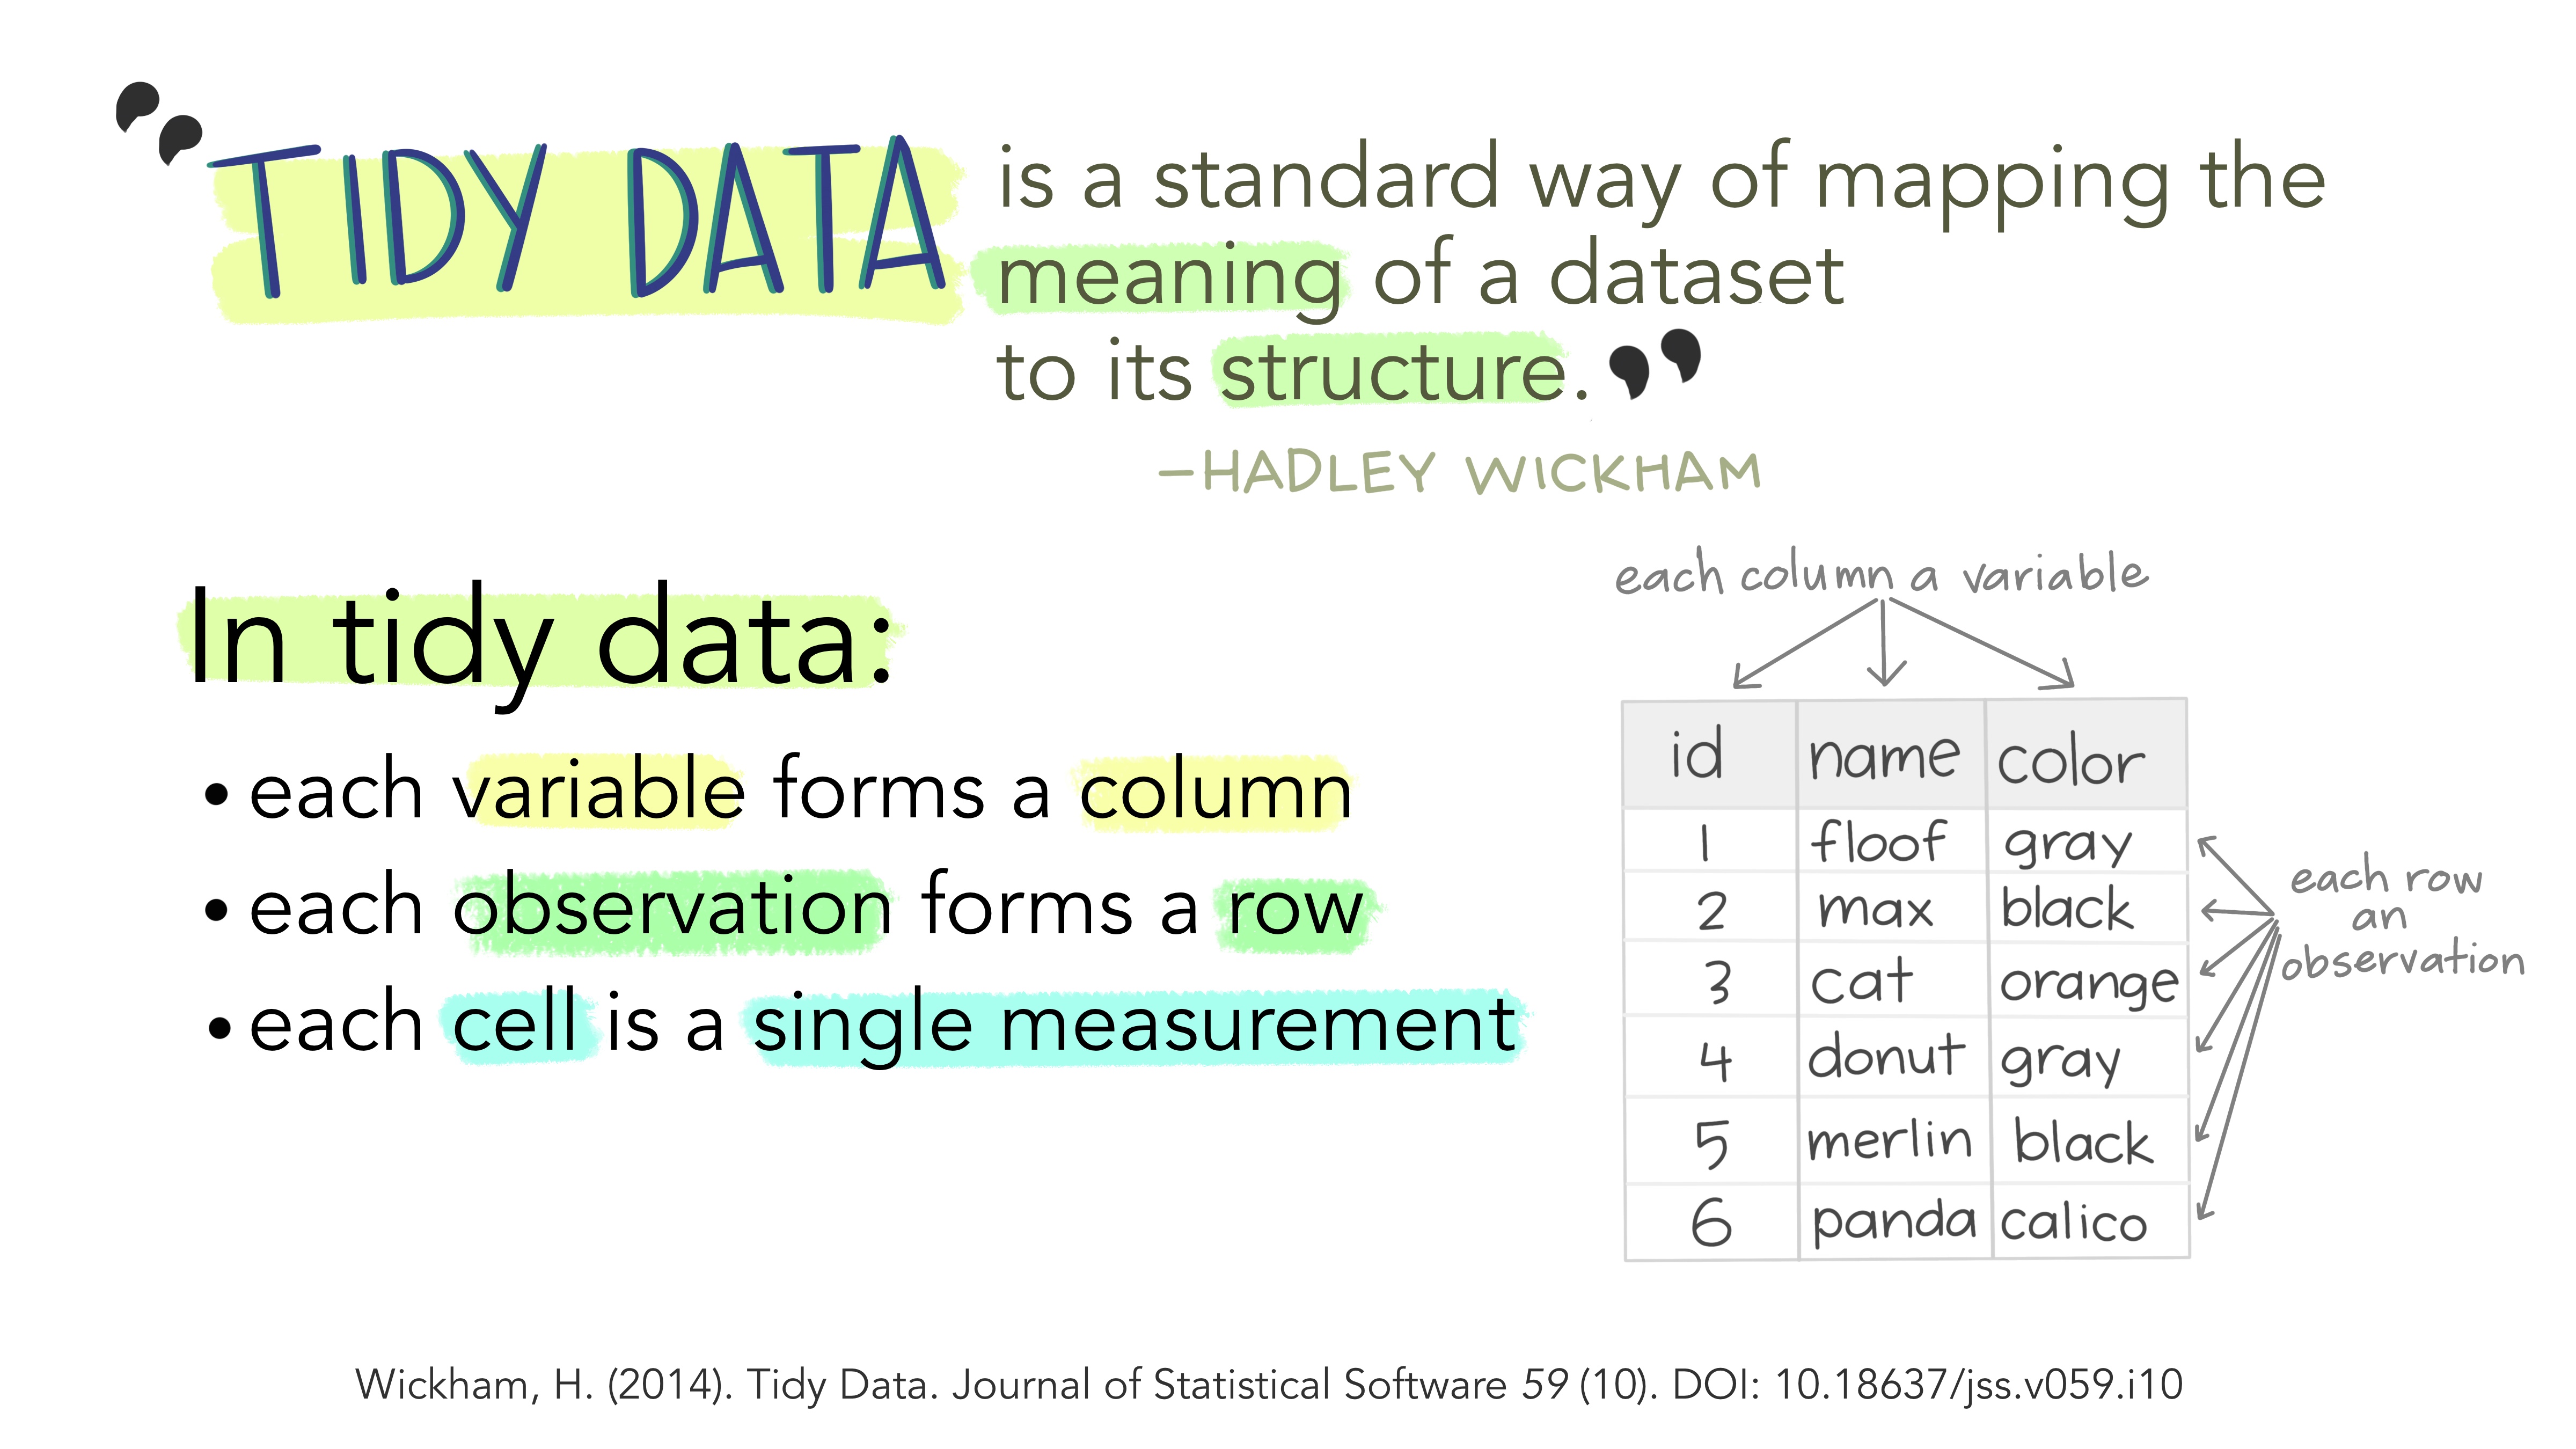
Tidy Data is a very simple—but very powerful—concept for structuring a dataset.
 Artwork by @allison_horst
Tidy Data: Definition#
A tidy dataset has three properties:
each variable forms a column
each observation forms a row
each cell is a single measurement
As an example, the following dataset is tidy:
from grama.data import df_stang
df_stang.head()
| thick | alloy | E | mu | ang | |
|---|---|---|---|---|---|
| 0 | 0.022 | al_24st | 10600 | 0.321 | 0 |
| 1 | 0.022 | al_24st | 10600 | 0.323 | 0 |
| 2 | 0.032 | al_24st | 10400 | 0.329 | 0 |
| 3 | 0.032 | al_24st | 10300 | 0.319 | 0 |
| 4 | 0.064 | al_24st | 10500 | 0.323 | 0 |
The observations are all measured material properties taken at a particular angle (with respect to the direction in which the specimens were rolled). Each column reports values for just one variable, each row corresponds to a single observation, and every cell reports just one measurement.
However, the following form of the same dataset is not tidy:
from grama.data import df_stang_wide
df_stang_wide
| thick | E_00 | mu_00 | E_45 | mu_45 | E_90 | mu_90 | alloy | |
|---|---|---|---|---|---|---|---|---|
| 0 | 0.022 | 10600 | 0.321 | 10700 | 0.329 | 10500 | 0.310 | al_24st |
| 1 | 0.022 | 10600 | 0.323 | 10500 | 0.331 | 10700 | 0.323 | al_24st |
| 2 | 0.032 | 10400 | 0.329 | 10400 | 0.318 | 10300 | 0.322 | al_24st |
| 3 | 0.032 | 10300 | 0.319 | 10500 | 0.326 | 10400 | 0.330 | al_24st |
| 4 | 0.064 | 10500 | 0.323 | 10400 | 0.331 | 10400 | 0.327 | al_24st |
| 5 | 0.064 | 10700 | 0.328 | 10500 | 0.328 | 10500 | 0.320 | al_24st |
| 6 | 0.081 | 10000 | 0.315 | 10000 | 0.320 | 9900 | 0.314 | al_24st |
| 7 | 0.081 | 10100 | 0.312 | 9900 | 0.312 | 10000 | 0.316 | al_24st |
| 8 | 0.081 | 10000 | 0.311 | -1 | -1.000 | 9900 | 0.314 | al_24st |
This dataset is not tidy: The angle of each measurement 00, 45, 90 is a variable, but these numerical values are expressed as column names. Put differently, some of the values are not in cells, but rather in the column names.
Why tidy data?#
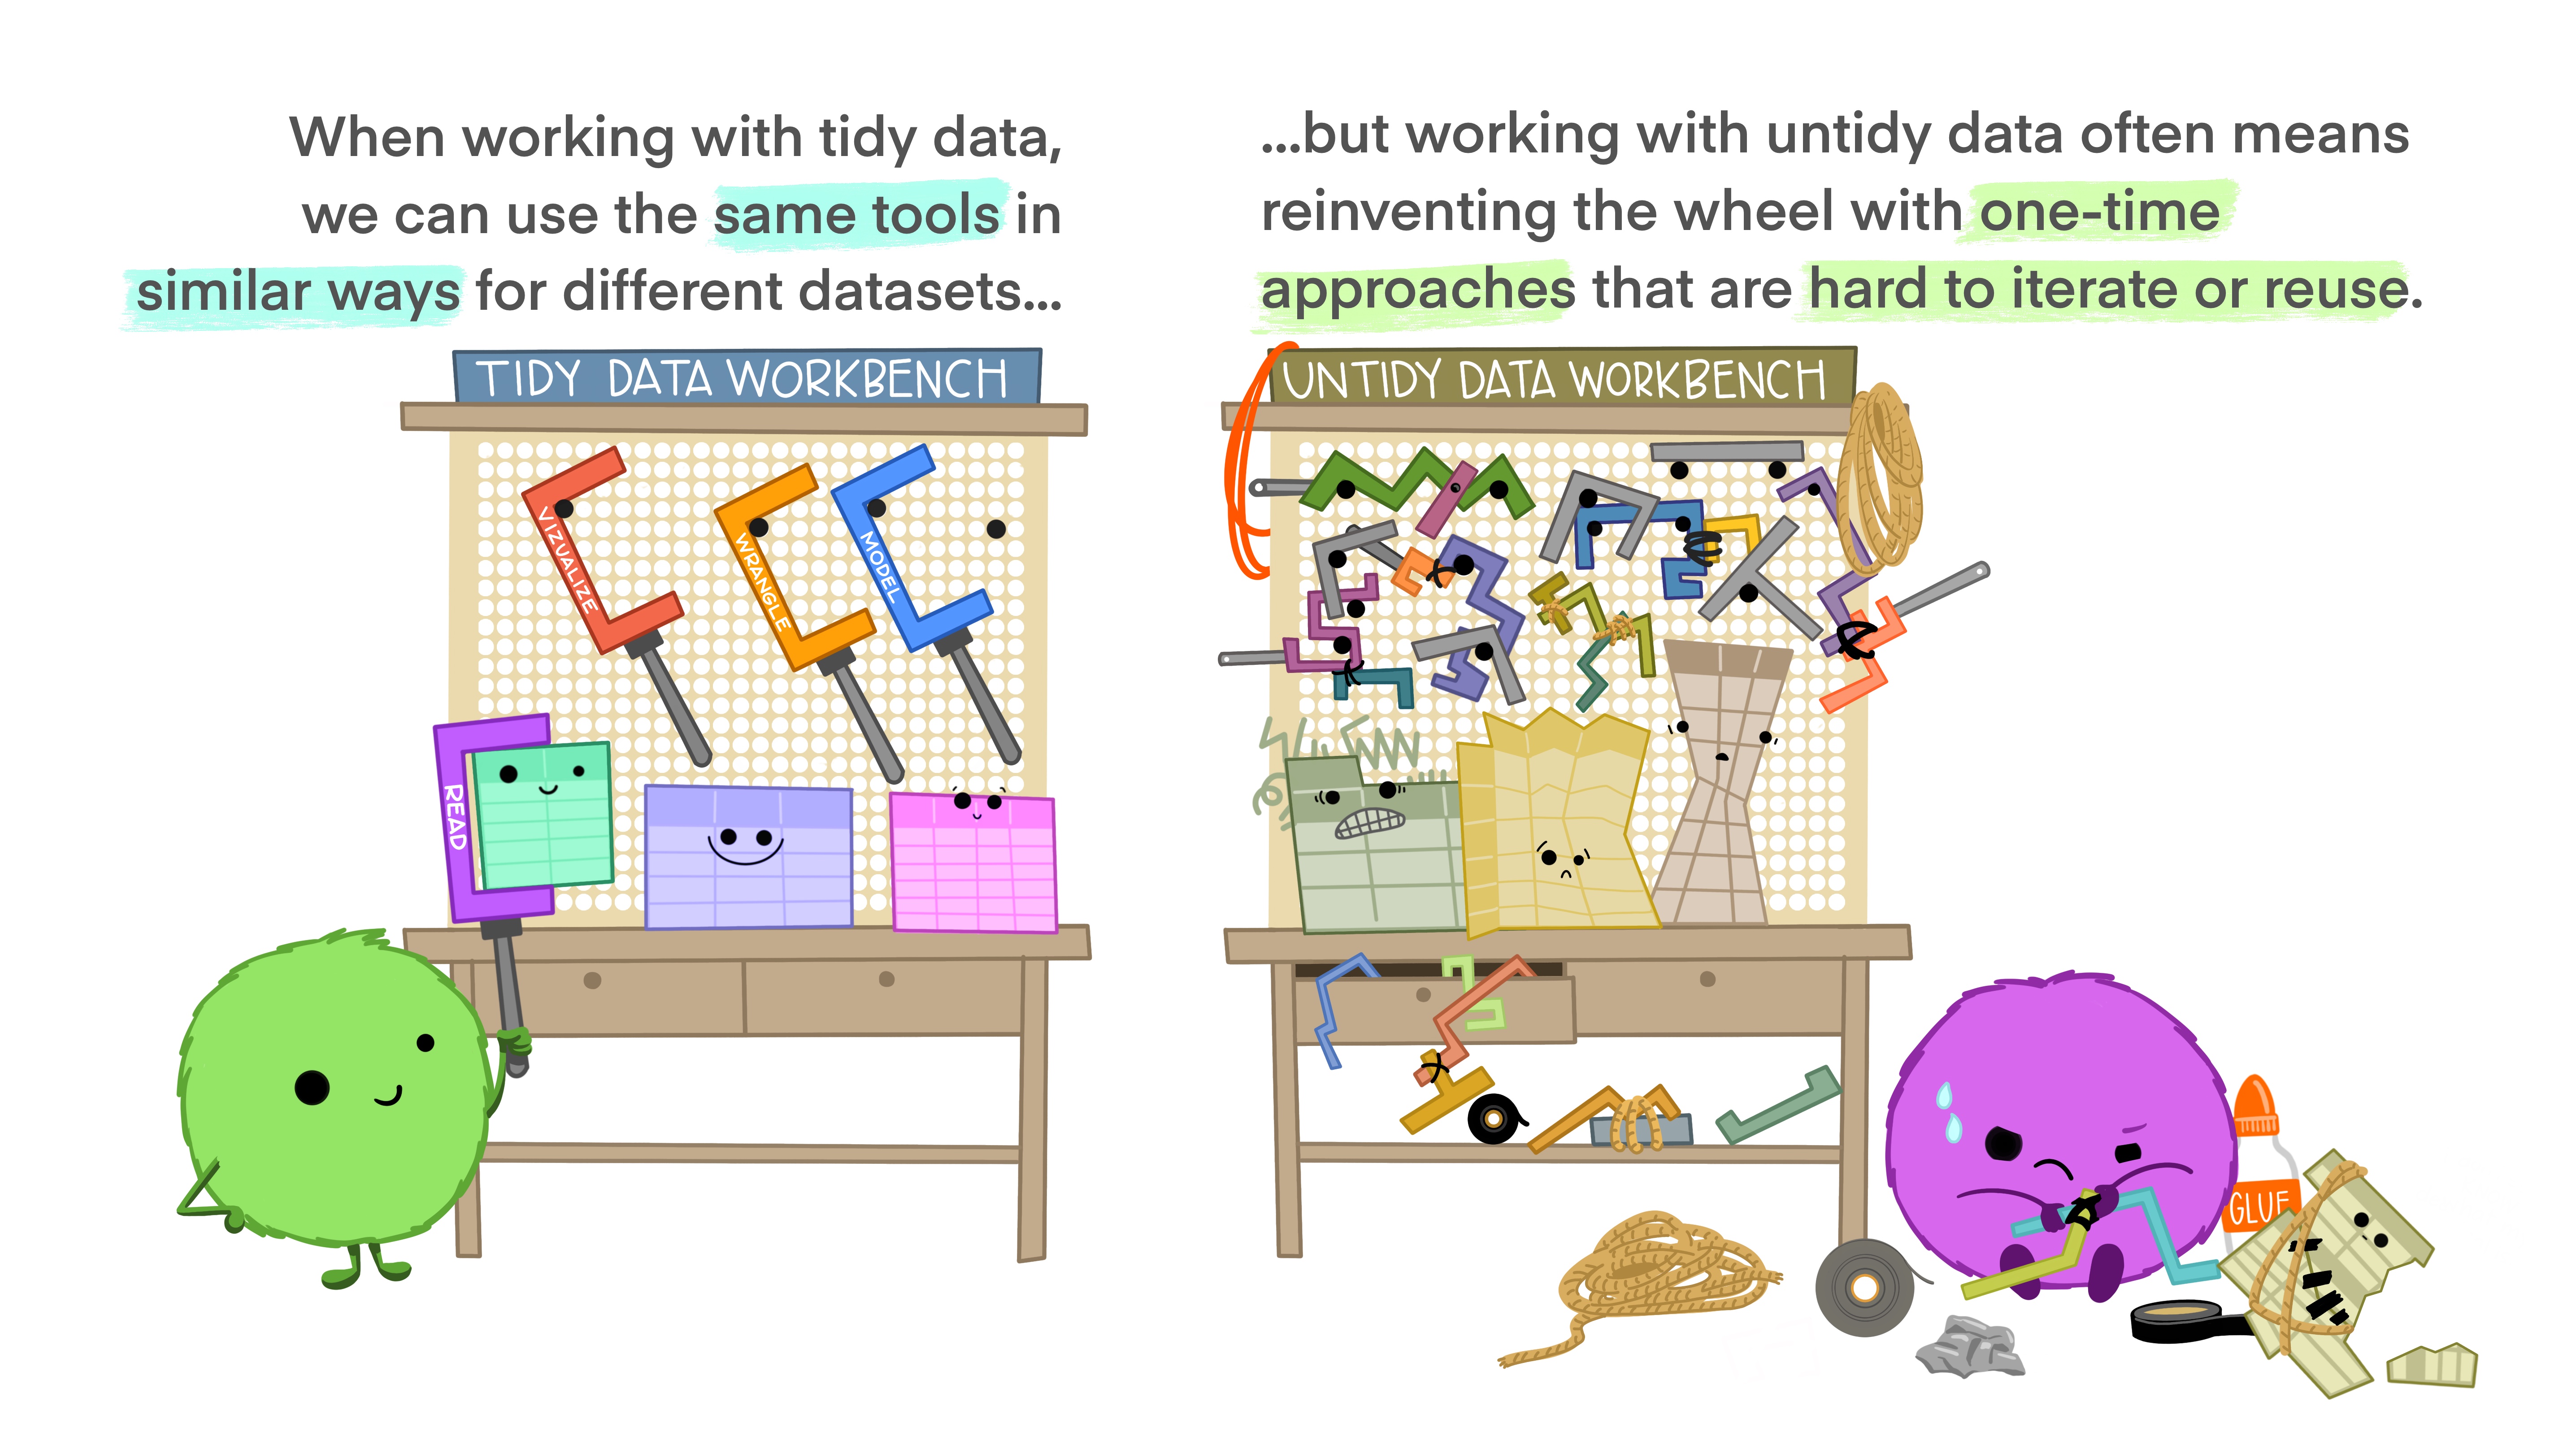
Tidy data makes analysis easier. Putting our data in tidy form means we can use a consistent set of tools to work with any dataset.
 Artwork by @allison_horst
Note that untidy data is not bad data; untidy data are simply harder to work with when doing data analysis. Data often come in untidy form when they are reported, say in a paper or a presentation. For instance, the wide form of the Stang et al. dataset can easily fit on one page:
df_stang_wide
| thick | E_00 | mu_00 | E_45 | mu_45 | E_90 | mu_90 | alloy | |
|---|---|---|---|---|---|---|---|---|
| 0 | 0.022 | 10600 | 0.321 | 10700 | 0.329 | 10500 | 0.310 | al_24st |
| 1 | 0.022 | 10600 | 0.323 | 10500 | 0.331 | 10700 | 0.323 | al_24st |
| 2 | 0.032 | 10400 | 0.329 | 10400 | 0.318 | 10300 | 0.322 | al_24st |
| 3 | 0.032 | 10300 | 0.319 | 10500 | 0.326 | 10400 | 0.330 | al_24st |
| 4 | 0.064 | 10500 | 0.323 | 10400 | 0.331 | 10400 | 0.327 | al_24st |
| 5 | 0.064 | 10700 | 0.328 | 10500 | 0.328 | 10500 | 0.320 | al_24st |
| 6 | 0.081 | 10000 | 0.315 | 10000 | 0.320 | 9900 | 0.314 | al_24st |
| 7 | 0.081 | 10100 | 0.312 | 9900 | 0.312 | 10000 | 0.316 | al_24st |
| 8 | 0.081 | 10000 | 0.311 | -1 | -1.000 | 9900 | 0.314 | al_24st |
However, the tidy form of the same dataset is far less compact:
df_stang
| thick | alloy | E | mu | ang | |
|---|---|---|---|---|---|
| 0 | 0.022 | al_24st | 10600 | 0.321 | 0 |
| 1 | 0.022 | al_24st | 10600 | 0.323 | 0 |
| 2 | 0.032 | al_24st | 10400 | 0.329 | 0 |
| 3 | 0.032 | al_24st | 10300 | 0.319 | 0 |
| 4 | 0.064 | al_24st | 10500 | 0.323 | 0 |
| ... | ... | ... | ... | ... | ... |
| 71 | 0.064 | al_24st | 10400 | 0.327 | 90 |
| 72 | 0.064 | al_24st | 10500 | 0.320 | 90 |
| 73 | 0.081 | al_24st | 9900 | 0.314 | 90 |
| 74 | 0.081 | al_24st | 10000 | 0.316 | 90 |
| 75 | 0.081 | al_24st | 9900 | 0.314 | 90 |
76 rows × 5 columns
Exercises#
Let’s practice identifying tidy and untidy data.
q1 Identify#
Inspect the following dataset; answer the questions under observations below.
## TASK: No need to edit; run and inspect
df_cases = gr.df_make(
    country=["FR", "DE", "US"],
    year2011=[7000, 5800, 15000],
    year2012=[6900, 6000, 14000],
    year2013=[7000, 6200, 13000],
)
df_cases
| country | year2011 | year2012 | year2013 | |
|---|---|---|---|---|
| 0 | FR | 7000 | 6900 | 7000 |
| 1 | DE | 5800 | 6000 | 6200 |
| 2 | US | 15000 | 14000 | 13000 |
Observations
What are the variables in this dataset?
Country, year, and some unknown quantity (n, count, etc.)
Is this dataset tidy? Why or why not?
No; the year values are in the column names.
q2 Identify#
Inspect the following dataset; answer the questions under observations below.
## TASK: No need to edit; run and inspect
df_alloys1 = gr.df_make(
    thick=[0.022, 0.022, 0.032, 0.032],
    E_00=[10600, 10600, 10400, 10300],
    mu_00=[0.321, 0.323, 0.329, 0.319],
    E_45=[10700, 10500, 10400, 10500],
    mu_45=[0.329, 0.331, 0.318, 0.326],
    rep=[1, 2, 1, 2],
)
df_alloys1
| thick | E_00 | mu_00 | E_45 | mu_45 | rep | |
|---|---|---|---|---|---|---|
| 0 | 0.022 | 10600 | 0.321 | 10700 | 0.329 | 1 |
| 1 | 0.022 | 10600 | 0.323 | 10500 | 0.331 | 2 |
| 2 | 0.032 | 10400 | 0.329 | 10400 | 0.318 | 1 |
| 3 | 0.032 | 10300 | 0.319 | 10500 | 0.326 | 2 |
Observations
What are the variables in this dataset?
Thickness
thick, elasticityE, poisson’s ratiomu, angle (in column names), replicationrep
Is this dataset tidy? Why or why not?
No; the angle values are in the column names.
q3 Identify#
Inspect the following dataset; answer the questions under observations below.
## TASK: No need to edit; run and inspect
df_alloys2 = gr.df_make(
    thick=[0.022, 0.022, 0.032, 0.032],
    var=["E", "mu", "E", "mu"],
    value=[10700, 0.321, 10500, 0.323],
    rep=[1, 1, 2, 2],
    angle=[0, 0, 0, 0],
)
df_alloys2
| thick | var | value | rep | angle | |
|---|---|---|---|---|---|
| 0 | 0.022 | E | 10700.000 | 1 | 0 |
| 1 | 0.022 | mu | 0.321 | 1 | 0 |
| 2 | 0.032 | E | 10500.000 | 2 | 0 |
| 3 | 0.032 | mu | 0.323 | 2 | 0 |
Observations
What are the variables in this dataset?
Thickness
thick, elasticityE, poisson’s ratiomu,angle, replicationrep
Is this dataset tidy? Why or why not?
No; the column
valuecontains values of two different variablesEandmu.
Pivoting Data#
The untidy datasets above fail to be tidy because they have the wrong shape; we can tidy these datasets by pivoting the data. There are just two pivots we need to learn about: tf_pivot_longer() and tf_pivot_wider().
Pivot Longer#
Let’s take another look at the df_cases example dataset:
## NOTE: No need to edit
df_cases
| country | year2011 | year2012 | year2013 | |
|---|---|---|---|---|
| 0 | FR | 7000 | 6900 | 7000 |
| 1 | DE | 5800 | 6000 | 6200 |
| 2 | US | 15000 | 14000 | 13000 |
This dataset is too wide; the column names year2011,year2012,year2013 should really be numbers inside a single year column. We can pivot longer to move from a wide structure to a longer one:
## NOTE: No need to edit
(
    df_cases
    >> gr.tf_pivot_longer(
        columns=["year2011", "year2012", "year2013"],
        names_to="year",
        values_to="count",
    )
)
| country | year | count | |
|---|---|---|---|
| 0 | FR | year2011 | 7000 |
| 1 | DE | year2011 | 5800 |
| 2 | US | year2011 | 15000 |
| 3 | FR | year2012 | 6900 |
| 4 | DE | year2012 | 6000 |
| 5 | US | year2012 | 14000 |
| 6 | FR | year2013 | 7000 |
| 7 | DE | year2013 | 6200 |
| 8 | US | year2013 | 13000 |
Note what we had to provide as arguments to gr.tf_pivot_longer():
columnsspecifies the columns to involve in the pivotingnames_tospecifies what new column will contain the previous column namesvalue_tospecifies what new column will contain the previous cell values
Often, a pivot alone is not enough to fully clean a dataset; for instance, we would still need to remove the year string from each cell entry. However, we can do this much more easily once the data are pivoted into a longer format:
## NOTE: No need to edit
(
    df_cases
    >> gr.tf_pivot_longer(
        columns=["year2011", "year2012", "year2013"],
        names_to="year",
        values_to="count",
    )
    >> gr.tf_mutate(year=gr.str_replace(DF.year, "year", ""))
)
| country | year | count | |
|---|---|---|---|
| 0 | FR | 2011 | 7000 |
| 1 | DE | 2011 | 5800 |
| 2 | US | 2011 | 15000 |
| 3 | FR | 2012 | 6900 |
| 4 | DE | 2012 | 6000 |
| 5 | US | 2012 | 14000 |
| 6 | FR | 2013 | 7000 |
| 7 | DE | 2013 | 6200 |
| 8 | US | 2013 | 13000 |
q4 Pivot the data#
Pivot the dataset df_alloys1 to place each of E_00, mu_00, E_45, mu_45 as values in a new variable column, and move the original values to a new value column. Answer the questions under observations below.
## TASK: Tidy the data, make sure to provide `variable` and `value` columns
df_res1 = (
    df_alloys1

    >> gr.tf_pivot_longer(
        columns=["E_00", "mu_00", "E_45", "mu_45"],
        names_to="variable",
        values_to="value",
    )
)

## NOTE: Use this to check your work
print(df_res1)

assert \
    {"thick", "rep", "variable", "value"} == set(df_res1.columns), \
    'columns of df_res1 are not ["thick", "rep", "variable", "value"]'

assert \
    {"E_00", "mu_00", "E_45", "mu_45"} == set(df_res1.variable), \
    'Entries in df_res1.variable are incorrect'
    thick  rep variable      value
0   0.022    1     E_00  10600.000
1   0.022    2     E_00  10600.000
2   0.032    1     E_00  10400.000
3   0.032    2     E_00  10300.000
4   0.022    1    mu_00      0.321
5   0.022    2    mu_00      0.323
6   0.032    1    mu_00      0.329
7   0.032    2    mu_00      0.319
8   0.022    1     E_45  10700.000
9   0.022    2     E_45  10500.000
10  0.032    1     E_45  10400.000
11  0.032    2     E_45  10500.000
12  0.022    1    mu_45      0.329
13  0.022    2    mu_45      0.331
14  0.032    1    mu_45      0.318
15  0.032    2    mu_45      0.326
Observations
Is this dataset tidy? Why or why not?
This dataset is not tidy; the entries in the
valuecolumn include values ofEandmu(two different variables). Also, thevariablecolumn contains both variable names and angle values.
Using selection helpers#
One useful feature of gr.tf_pivot_longer() is that we can use selection helpers to choose which columns to use in a pivot. This can save us a lot of typing, and allows us to write code that can react to multiple different datasets. Let’s practice using selection helpers by re-doing the previous task.
q5 Simplify with selection helpers#
Use a single selection helper to simplify the columns argument to gr.tf_pivot_longer().
Hint: There are multiple ways to do this: The string "E|mu" will match the strings "E" or "mu". The string "\\d+" will match any string of consecutive digits.
## TASK: Replace the `columns` argument with a selection helper
df_simplified = (
    df_alloys1
    >> gr.tf_pivot_longer(

        columns=gr.matches("E|mu"),
        names_to="variable",
        values_to="value",
    )
)

## NOTE: Use this to check your work
print(df_simplified)

assert \
    {"thick", "rep", "variable", "value"} == set(df_simplified.columns), \
    'columns of df_res1 are not ["thick", "rep", "variable", "value"]'

assert \
    {"E_00", "mu_00", "E_45", "mu_45"} == set(df_simplified.variable), \
    'Entries in df_res1.variable are incorrect'
    thick  rep variable      value
0   0.022    1     E_00  10600.000
1   0.022    2     E_00  10600.000
2   0.032    1     E_00  10400.000
3   0.032    2     E_00  10300.000
4   0.022    1    mu_00      0.321
5   0.022    2    mu_00      0.323
6   0.032    1    mu_00      0.329
7   0.032    2    mu_00      0.319
8   0.022    1     E_45  10700.000
9   0.022    2     E_45  10500.000
10  0.032    1     E_45  10400.000
11  0.032    2     E_45  10500.000
12  0.022    1    mu_45      0.329
13  0.022    2    mu_45      0.331
14  0.032    1    mu_45      0.318
15  0.032    2    mu_45      0.326
Pivot Wider#
Just as a dataset can be “too wide”, it can also be “too long.” In this case, we can use gr.tf_pivot_wider(). Let’s look at an illustrative example:
## NOTE: No need to edit
df_long = gr.df_make(
    variable=["x", "y", "f", "x", "y", "f"],
    value=[0, 0, 1, 0, 1, 0],
    observation=[0, 0, 0, 1, 1, 1],
)
df_long
| variable | value | observation | |
|---|---|---|---|
| 0 | x | 0 | 0 |
| 1 | y | 0 | 0 |
| 2 | f | 1 | 0 |
| 3 | x | 0 | 1 |
| 4 | y | 1 | 1 |
| 5 | f | 0 | 1 |
Here, the value column has mixed variables; values of x, y, and f comingle in the value column. Really we should have the columns x, y, and f: In this sense the data is too long. Let’s pivot wider to tidy the data.
## NOTE: No need to edit
(
    df_long
    >> gr.tf_pivot_wider(
        names_from="variable",
        values_from="value",
    )
)
| observation | f | x | y | |
|---|---|---|---|---|
| 0 | 0 | 1 | 0 | 0 |
| 1 | 1 | 0 | 0 | 1 |
Note that we had to provide just two inputs to gr.tf_pivot_wider():
names_fromspecifies which column will provide the new column namesvalue_fromspecifies which column will provide the new column values
Let’s get some practice!
q6 Pivot the data#
Pivot the dataset df_alloys2 to provide E and mu as columns in df_res2. Answer the questions under observations below.
## TASK: Pivot the dataset wider
df_res2 = (
    df_alloys2
    >> gr.tf_pivot_wider(
        names_from="var",
        values_from="value",
    )
)

## NOTE: Use the following to check your work
print(df_res2)

assert \
    {"thick", "rep", "angle", "E", "mu"} == set(df_res2.columns), \
    'df_res2 does not have the columns ["thick", "rep", "angle", "E", "mu"]'
   thick  rep  angle        E     mu
0  0.022    1      0  10700.0  0.321
1  0.032    2      0  10500.0  0.323
Observations
Is this dataset tidy? Why or why not?
This dataset is tidy! Every column is one variable, every row is one observation, and every cell contains one value.
Warning: No observation identifier#
While the arguments to gr.tf_pivot_wider() only target two columns, we do need to think carefully about what other columns are in the dataset. It is important that the other columns help identify which values are associated with the same observation—the easiest way to do this is with some sort of observation identifier column.
Let’s take a look at what happens when we do not have a way to associate values with the same observation:
## NOTE: No need to edit
(
    gr.df_make(
        variable=["x", "y", "f", "x", "y", "f"],
        value=[0, 0, 1, 0, 1, 0],
        # observation=[0, 0, 0, 1, 1, 1], # Remove the observation identifier
    )
    >> gr.tf_pivot_wider(
        names_from="variable",
        values_from="value",
    )
)
| f | x | y | |
|---|---|---|---|
| 0 | NaN | 0.0 | NaN |
| 1 | NaN | NaN | 0.0 |
| 2 | 1.0 | NaN | NaN |
| 3 | NaN | 0.0 | NaN |
| 4 | NaN | NaN | 1.0 |
| 5 | 0.0 | NaN | NaN |
Note that gr.tf_pivot_wider() placed all of the values in the “correct” column, but filled all over column values with NaNs. If you get strange behavior with gr.tf_pivot_wider(), you should think about whether you are providing the information necessary to associate common values with the same observation. We’ll learn more about this in the next exercise.