Demo Notebook 2022-07-06#
Demos from the live sessions on 2022-07-06.
Setup#
Ye olde setup chunk below.
import grama as gr
import pandas as pd
import numpy as np
DF = gr.Intention()
%matplotlib inline
from grama.data import df_stang_wide
df_stang_wide
| thick | E_00 | mu_00 | E_45 | mu_45 | E_90 | mu_90 | alloy | |
|---|---|---|---|---|---|---|---|---|
| 0 | 0.022 | 10600 | 0.321 | 10700 | 0.329 | 10500 | 0.310 | al_24st |
| 1 | 0.022 | 10600 | 0.323 | 10500 | 0.331 | 10700 | 0.323 | al_24st |
| 2 | 0.032 | 10400 | 0.329 | 10400 | 0.318 | 10300 | 0.322 | al_24st |
| 3 | 0.032 | 10300 | 0.319 | 10500 | 0.326 | 10400 | 0.330 | al_24st |
| 4 | 0.064 | 10500 | 0.323 | 10400 | 0.331 | 10400 | 0.327 | al_24st |
| 5 | 0.064 | 10700 | 0.328 | 10500 | 0.328 | 10500 | 0.320 | al_24st |
| 6 | 0.081 | 10000 | 0.315 | 10000 | 0.320 | 9900 | 0.314 | al_24st |
| 7 | 0.081 | 10100 | 0.312 | 9900 | 0.312 | 10000 | 0.316 | al_24st |
| 8 | 0.081 | 10000 | 0.311 | -1 | -1.000 | 9900 | 0.314 | al_24st |
Wrangling Data#
df_stang = (
    df_stang_wide
    ## Single-call pivoting of the data
    >> gr.tf_pivot_longer(
        columns=["E_00", "mu_00", "E_45", "mu_45", "E_90", "mu_90"],
        names_to=[".value", "angle"],
        names_sep="_"
    )
    ## Filter out the invalid values
    >> gr.tf_filter(DF.E > 0)
    ## Convert angle values to numeric
    >> gr.tf_mutate(
        angle=gr.as_float(DF.angle)
    )
)

df_stang
/Users/zach/Git/py_grama/grama/tran_pivot.py:570: SettingWithCopyWarning:
A value is trying to be set on a copy of a slice from a DataFrame

See the caveats in the documentation: https://pandas.pydata.org/pandas-docs/stable/user_guide/indexing.html#returning-a-view-versus-a-copy
| thick | alloy | angle | E | mu | |
|---|---|---|---|---|---|
| 0 | 0.022 | al_24st | 0.0 | 10600.0 | 0.321 |
| 1 | 0.022 | al_24st | 45.0 | 10700.0 | 0.329 |
| 2 | 0.022 | al_24st | 90.0 | 10500.0 | 0.310 |
| 3 | 0.022 | al_24st | 0.0 | 10600.0 | 0.323 |
| 4 | 0.022 | al_24st | 45.0 | 10500.0 | 0.331 |
| 5 | 0.022 | al_24st | 90.0 | 10700.0 | 0.323 |
| 6 | 0.032 | al_24st | 0.0 | 10400.0 | 0.329 |
| 7 | 0.032 | al_24st | 45.0 | 10400.0 | 0.318 |
| 8 | 0.032 | al_24st | 90.0 | 10300.0 | 0.322 |
| 9 | 0.032 | al_24st | 0.0 | 10300.0 | 0.319 |
| 10 | 0.032 | al_24st | 45.0 | 10500.0 | 0.326 |
| 11 | 0.032 | al_24st | 90.0 | 10400.0 | 0.330 |
| 12 | 0.064 | al_24st | 0.0 | 10500.0 | 0.323 |
| 13 | 0.064 | al_24st | 45.0 | 10400.0 | 0.331 |
| 14 | 0.064 | al_24st | 90.0 | 10400.0 | 0.327 |
| 15 | 0.064 | al_24st | 0.0 | 10700.0 | 0.328 |
| 16 | 0.064 | al_24st | 45.0 | 10500.0 | 0.328 |
| 17 | 0.064 | al_24st | 90.0 | 10500.0 | 0.320 |
| 18 | 0.081 | al_24st | 0.0 | 10000.0 | 0.315 |
| 19 | 0.081 | al_24st | 45.0 | 10000.0 | 0.320 |
| 20 | 0.081 | al_24st | 90.0 | 9900.0 | 0.314 |
| 21 | 0.081 | al_24st | 0.0 | 10100.0 | 0.312 |
| 22 | 0.081 | al_24st | 45.0 | 9900.0 | 0.312 |
| 23 | 0.081 | al_24st | 90.0 | 10000.0 | 0.316 |
| 24 | 0.081 | al_24st | 0.0 | 10000.0 | 0.311 |
| 25 | 0.081 | al_24st | 90.0 | 9900.0 | 0.314 |
df_stang_invalid = (
    df_stang_wide
    ## Single-call pivoting of the data
    >> gr.tf_pivot_longer(
        columns=["E_00", "mu_00", "E_45", "mu_45", "E_90", "mu_90"],
        names_to=[".value", "angle"],
        names_sep="_"
    )
    ## Leave in the invalid values
    # >> gr.tf_filter(DF.E > 0)
    ## Convert angle values to numeric
    >> gr.tf_mutate(
        angle=gr.as_float(DF.angle)
    )
)

df_stang_invalid
/Users/zach/Git/py_grama/grama/tran_pivot.py:570: SettingWithCopyWarning:
A value is trying to be set on a copy of a slice from a DataFrame

See the caveats in the documentation: https://pandas.pydata.org/pandas-docs/stable/user_guide/indexing.html#returning-a-view-versus-a-copy
| thick | alloy | angle | E | mu | |
|---|---|---|---|---|---|
| 0 | 0.022 | al_24st | 0.0 | 10600.0 | 0.321 |
| 1 | 0.022 | al_24st | 45.0 | 10700.0 | 0.329 |
| 2 | 0.022 | al_24st | 90.0 | 10500.0 | 0.310 |
| 3 | 0.022 | al_24st | 0.0 | 10600.0 | 0.323 |
| 4 | 0.022 | al_24st | 45.0 | 10500.0 | 0.331 |
| 5 | 0.022 | al_24st | 90.0 | 10700.0 | 0.323 |
| 6 | 0.032 | al_24st | 0.0 | 10400.0 | 0.329 |
| 7 | 0.032 | al_24st | 45.0 | 10400.0 | 0.318 |
| 8 | 0.032 | al_24st | 90.0 | 10300.0 | 0.322 |
| 9 | 0.032 | al_24st | 0.0 | 10300.0 | 0.319 |
| 10 | 0.032 | al_24st | 45.0 | 10500.0 | 0.326 |
| 11 | 0.032 | al_24st | 90.0 | 10400.0 | 0.330 |
| 12 | 0.064 | al_24st | 0.0 | 10500.0 | 0.323 |
| 13 | 0.064 | al_24st | 45.0 | 10400.0 | 0.331 |
| 14 | 0.064 | al_24st | 90.0 | 10400.0 | 0.327 |
| 15 | 0.064 | al_24st | 0.0 | 10700.0 | 0.328 |
| 16 | 0.064 | al_24st | 45.0 | 10500.0 | 0.328 |
| 17 | 0.064 | al_24st | 90.0 | 10500.0 | 0.320 |
| 18 | 0.081 | al_24st | 0.0 | 10000.0 | 0.315 |
| 19 | 0.081 | al_24st | 45.0 | 10000.0 | 0.320 |
| 20 | 0.081 | al_24st | 90.0 | 9900.0 | 0.314 |
| 21 | 0.081 | al_24st | 0.0 | 10100.0 | 0.312 |
| 22 | 0.081 | al_24st | 45.0 | 9900.0 | 0.312 |
| 23 | 0.081 | al_24st | 90.0 | 10000.0 | 0.316 |
| 24 | 0.081 | al_24st | 0.0 | 10000.0 | 0.311 |
| 25 | 0.081 | al_24st | 45.0 | -1.0 | -1.000 |
| 26 | 0.081 | al_24st | 90.0 | 9900.0 | 0.314 |
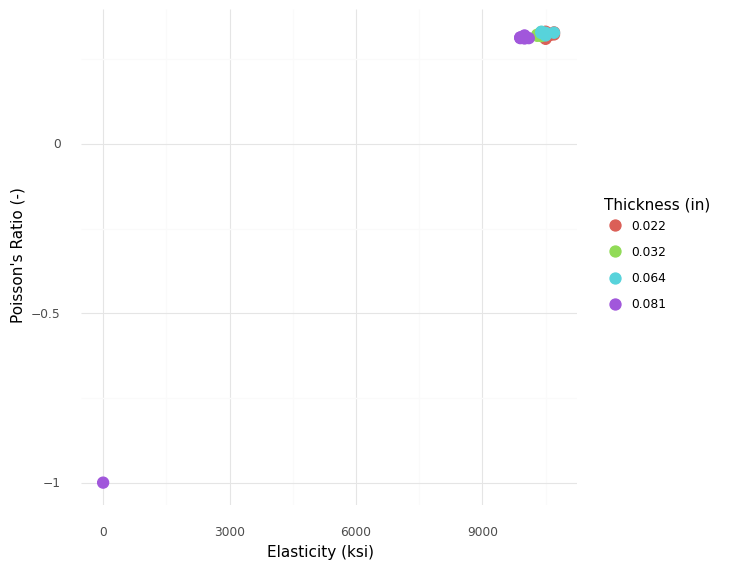
Note that observation df_stang_invalid.index == 25 has E == -1, which is not a valid number for this material property.
# NOTE: No need to edit; run and inspect
p = (
    df_stang_invalid
    >> gr.ggplot(gr.aes("E", "mu", color="factor(thick)"))
    + gr.geom_point(size=4)

    + gr.scale_color_discrete(name="Thickness (in)")
    + gr.theme_minimal()
    + gr.theme(aspect_ratio=1)
    + gr.labs(
        x="Elasticity (ksi)",
        y="Poisson's Ratio (-)",
    )
)
p.save("stang-E-mu-incorrect.png")
p
/Users/zach/opt/anaconda3/envs/evc/lib/python3.9/site-packages/plotnine/ggplot.py:719: PlotnineWarning: Saving 6.4 x 4.8 in image.
/Users/zach/opt/anaconda3/envs/evc/lib/python3.9/site-packages/plotnine/ggplot.py:722: PlotnineWarning: Filename: stang-E-mu-incorrect.png
<ggplot: (8766095560424)>
Note that the invalid value heavily skews the plot, making it difficult to see trends in the dataset. This does help us detect that one of the values is incorrect, though!
# NOTE: No need to edit; run and inspect
p = (
    df_stang
    >> gr.ggplot(gr.aes("E", "mu", color="factor(thick)"))
    + gr.geom_point(size=4)

    + gr.scale_color_discrete(name="Thickness (in)")
    + gr.theme_minimal()
    + gr.theme(aspect_ratio=1)
    + gr.labs(
        x="Elasticity (ksi)",
        y="Poisson's Ratio (-)",
    )
)
p.save("stang-E-mu.png")
p
/Users/zach/opt/anaconda3/envs/evc/lib/python3.9/site-packages/plotnine/ggplot.py:719: PlotnineWarning: Saving 6.4 x 4.8 in image.
/Users/zach/opt/anaconda3/envs/evc/lib/python3.9/site-packages/plotnine/ggplot.py:722: PlotnineWarning: Filename: stang-E-mu.png
<ggplot: (8766079044100)>
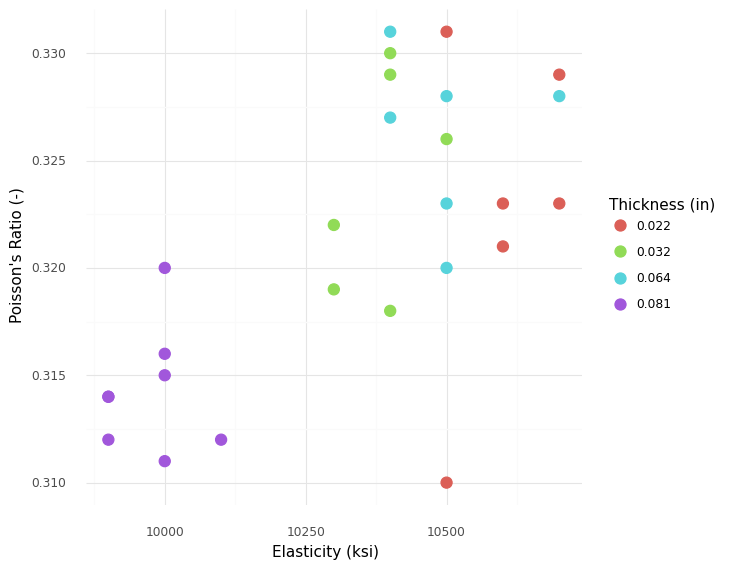
Explanatory Patterns#
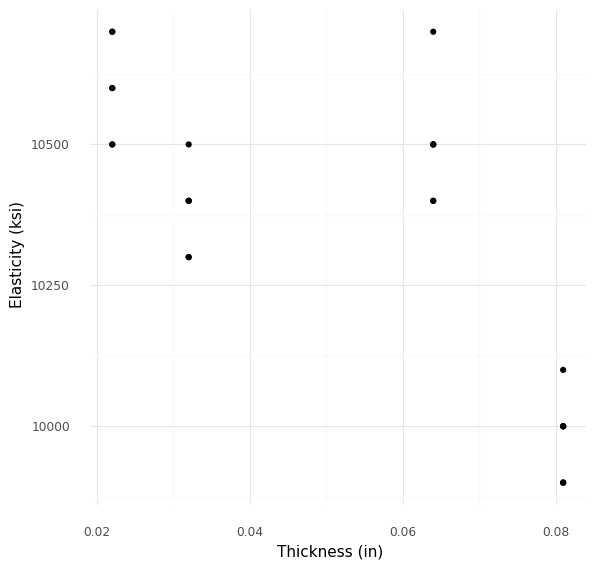
Plotting E against t directly helps us assess the supposed pattern.
p = (
    df_stang
    >> gr.ggplot(gr.aes("thick", "E"))
    + gr.geom_point()
    + gr.theme_minimal()
    + gr.theme(
        aspect_ratio=1,
    )
    + gr.labs(
        x="Thickness (in)",
        y="Elasticity (ksi)",
    )
)
p.save("stang-cf.png")
p
/Users/zach/opt/anaconda3/envs/evc/lib/python3.9/site-packages/plotnine/ggplot.py:719: PlotnineWarning: Saving 6.4 x 4.8 in image.
/Users/zach/opt/anaconda3/envs/evc/lib/python3.9/site-packages/plotnine/ggplot.py:722: PlotnineWarning: Filename: stang-cf.png
<ggplot: (8766133993735)>
Already, this pattern doesn’t look very convincing; the intermediate thickness plates (t ~= 0.06) do not follow the downward trend in E.
p = (
    df_stang
    >> gr.ggplot(gr.aes("thick", "E"))
    + gr.geom_point()
    + gr.geom_smooth(
        data=df_stang
        >> gr.tf_mutate(source="All"),
        mapping=gr.aes(color="source"),
        method="lm"
    )
    + gr.geom_smooth(
        data=df_stang
        >> gr.tf_filter(DF.thick <= 0.08)
        >> gr.tf_mutate(source="t<0.08"),
        mapping=gr.aes(color="source"),
        method="lm"
    )
    + gr.theme_minimal()
    + gr.theme(
        aspect_ratio=1,
    )
    + gr.labs(
        x="Thickness (in)",
        y="Elasticity (ksi)",
    )
)
p.save("stang-cf-lm.png")
p
/Users/zach/opt/anaconda3/envs/evc/lib/python3.9/site-packages/plotnine/ggplot.py:719: PlotnineWarning: Saving 6.4 x 4.8 in image.
/Users/zach/opt/anaconda3/envs/evc/lib/python3.9/site-packages/plotnine/ggplot.py:722: PlotnineWarning: Filename: stang-cf-lm.png
<ggplot: (8766079043079)>
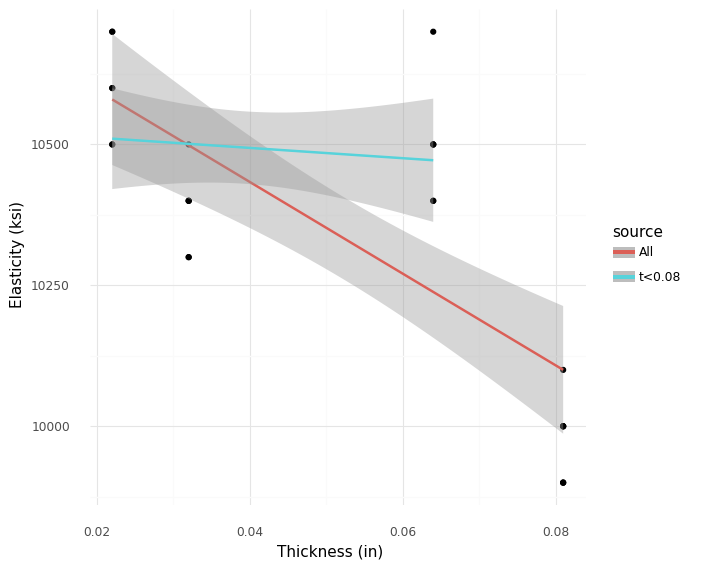
A more formal way to test the supposed trend is to fit a pair of lines, one with and one without the thickest plates. Here we can see that the line fitted without the thickest plates does not have a significantly downward slope.
Considering Variability#
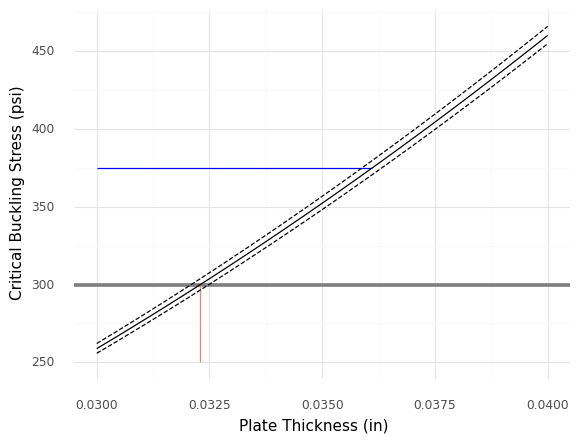
The following code shows how to make the “targeted” figures I showed in the presentation.
md_plate = (
    gr.Model("Plate critical buckling stress")
    >> gr.cp_vec_function(
        fun=lambda df: gr.df_make(
            k_cr=(df.m * df.b / df.a + df.a / df.m / df.b)**2
        ),
        var=["a", "b", "m"],
        out=["k_cr"],
    )
    >> gr.cp_vec_function(
        fun=lambda df: gr.df_make(
            sigma_cr=df.k_cr * (np.pi**2/12) * df.E*1e3 / (1 - df.mu**2)
                    *(df.t / df.b)**2
        ),
        var=["k_cr", "E", "mu", "t", "b"],
        out=["sigma_cr"]
    )
)

md_plate
model: Plate critical buckling stress

  inputs:
    var_det:
      b: (unbounded)
      a: (unbounded)
      t: (unbounded)
      mu: (unbounded)
      m: (unbounded)
      E: (unbounded)

    var_rand:

    copula:
      None

  functions:
      f0: ['a', 'b', 'm'] -> ['k_cr']
      f1: ['k_cr', 'E', 'mu', 't', 'b'] -> ['sigma_cr']
p = (
    df_stang
    >> gr.tf_filter(DF.thick == 0.032)
    >> gr.tf_rename(t="thick")

    # Sweep over additional variables
    >> gr.tf_outer(
        df_outer=gr.df_grid(
            m=[1, 2, 3],
            a=gr.linspace(6, 48, 25),
            b=12,
        )
    )
    # Use the model as a transformation (evaluation synonym)
    >> gr.tf_md(md_plate)

    # Compute summaries
    >> gr.tf_group_by(DF.a, DF.m, DF.b)
    >> gr.tf_summarize(
        sigma_cr_min=gr.min(DF.sigma_cr),
        sigma_cr_mean=gr.mean(DF.sigma_cr),
        sigma_cr_max=gr.max(DF.sigma_cr),
    )

    # Visualize the results
    >> gr.ggplot(gr.aes("a / b", color="factor(m)"))
    + gr.geom_ribbon(
        gr.aes(ymin="sigma_cr_min", ymax="sigma_cr_max"),
        linetype="dashed",
        fill=None,
    )
    + gr.geom_line(gr.aes(y="sigma_cr_mean"))

    + gr.scale_x_continuous(breaks=[1, 1.5, 2, 2.5, 3])
    + gr.scale_y_continuous(limits=(200, 1200))
    + gr.scale_color_discrete(name="Wavenumber")
    + gr.theme_minimal()
    + gr.labs(
        x="Aspect Ratio (-)",
        y="Critical Buckling Stress (psi)"
    )
)
p.save("stang-q7.png")
p
/Users/zach/opt/anaconda3/envs/evc/lib/python3.9/site-packages/plotnine/ggplot.py:719: PlotnineWarning: Saving 6.4 x 4.8 in image.
/Users/zach/opt/anaconda3/envs/evc/lib/python3.9/site-packages/plotnine/ggplot.py:722: PlotnineWarning: Filename: stang-q7.png

<ggplot: (8766079085629)>
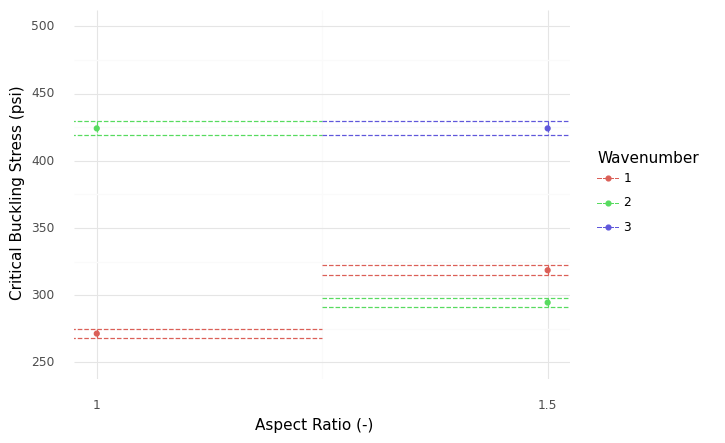
We can make a more targeted figure to focus on the relevant comparison (AR == 1.0 vs AR == 1.5).
p = (
    df_stang
    >> gr.tf_filter(DF.thick == 0.032)
    >> gr.tf_rename(t="thick")

    # Sweep over additional variables
    >> gr.tf_outer(
        df_outer=gr.df_grid(
            m=[1, 2, 3],
            a=[12 * 1, 12 * 1.5],
            b=12,
        )
    )
    # Use the model as a transformation (evaluation synonym)
    >> gr.tf_md(md_plate)

    # Compute summaries
    >> gr.tf_group_by(DF.a, DF.m, DF.b)
    >> gr.tf_summarize(
        sigma_cr_min=gr.min(DF.sigma_cr),
        sigma_cr_mean=gr.mean(DF.sigma_cr),
        sigma_cr_max=gr.max(DF.sigma_cr),
    )

    # Visualize the results
    >> gr.ggplot(gr.aes("a / b", color="factor(m)"))
    + gr.geom_errorbar(
        gr.aes(ymin="sigma_cr_min", ymax="sigma_cr_max"),
        linetype="dashed",
        # fill=None,
    )
    + gr.geom_point(gr.aes(y="sigma_cr_mean"))

    + gr.scale_x_continuous(breaks=[1, 1.5, 2, 2.5, 3])
    + gr.scale_y_continuous(limits=(200, 1200))
    + gr.coord_cartesian(
        xlim=(1.0, 1.5),
        ylim=(250, 500),
    )
    + gr.scale_color_discrete(name="Wavenumber")
    + gr.theme_minimal()
    + gr.labs(
        x="Aspect Ratio (-)",
        y="Critical Buckling Stress (psi)"
    )
)
p.save("stang-q7-zoom.png")
p
/Users/zach/opt/anaconda3/envs/evc/lib/python3.9/site-packages/plotnine/ggplot.py:719: PlotnineWarning: Saving 6.4 x 4.8 in image.
/Users/zach/opt/anaconda3/envs/evc/lib/python3.9/site-packages/plotnine/ggplot.py:722: PlotnineWarning: Filename: stang-q7-zoom.png
<ggplot: (8766095694734)>
The case AR == 1 clearly has a lower buckling stress than the lowest AR == 1.5 case; independent of the material variability, we can determine that AR == 1.5 is a better choice for our application.
In this sense, the material variability does not matter for the purposes of choosing between AR == 1.0 and AR == 1.5.
p = (
    df_stang
    >> gr.tf_filter(DF.thick == 0.032)
    >> gr.tf_drop("thick")

    # Sweep over thicknesses
    >> gr.tf_outer(
        df_outer=gr.df_grid(
            t=gr.linspace(0.030, 0.04, 25),
            a=12 * 1.5,
            b=12,
            m=2,
        )
    )

    # Use model as a transform
    >> gr.tf_md(md_plate)

    # Compute summaries
    >> gr.tf_group_by(DF.t)
    >> gr.tf_summarize(
        sigma_cr_min=gr.min(DF.sigma_cr),
        sigma_cr_mean=gr.mean(DF.sigma_cr),
        sigma_cr_max=gr.max(DF.sigma_cr),
    )

    # Visualize
    >> gr.ggplot(gr.aes("t"))
    + gr.geom_hline(yintercept=300, color="grey", size=1.5)
    + gr.geom_segment(
        data=gr.df_make(
            t=0.0323,
            y=300-50,
            yend=300,
        ),
        mapping=gr.aes("t", "y", xend="t", yend="yend"),
        color="salmon",
    )
    + gr.geom_segment(
        data=gr.df_make(
            y=300 * 1.25,
            t=0.03,
            tend=0.0361,
        ),
        mapping=gr.aes("t", "y", xend="tend", yend="y"),
        color="blue",
    )
    + gr.geom_line(gr.aes(y="sigma_cr_min"), linetype="dashed")
    + gr.geom_line(gr.aes(y="sigma_cr_mean"))
    + gr.geom_line(gr.aes(y="sigma_cr_max"), linetype="dashed")

    + gr.theme_minimal()
    + gr.labs(
        x="Plate Thickness (in)",
        y="Critical Buckling Stress (psi)"
    )
)
p.save("stang-q8.png")
p
/Users/zach/opt/anaconda3/envs/evc/lib/python3.9/site-packages/plotnine/ggplot.py:719: PlotnineWarning: Saving 6.4 x 4.8 in image.
/Users/zach/opt/anaconda3/envs/evc/lib/python3.9/site-packages/plotnine/ggplot.py:722: PlotnineWarning: Filename: stang-q8.png
<ggplot: (8766113690871)>
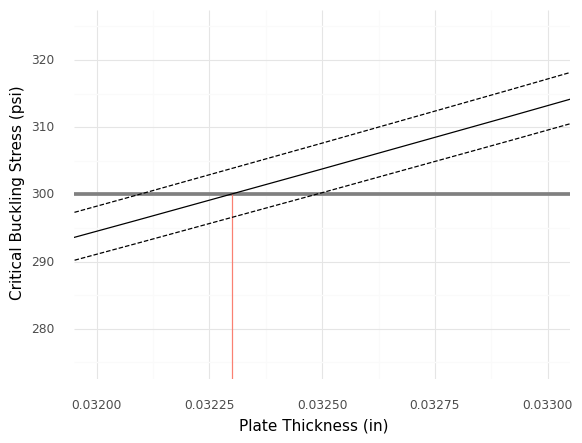
p = (
    df_stang
    >> gr.tf_filter(DF.thick == 0.032)
    >> gr.tf_drop("thick")

    # Sweep over thicknesses
    >> gr.tf_outer(
        df_outer=gr.df_grid(
            t=gr.linspace(0.030, 0.04, 25),
            a=12 * 1.5,
            b=12,
            m=2,
        )
    )

    # Use model as a transform
    >> gr.tf_md(md_plate)

    # Compute summaries
    >> gr.tf_group_by(DF.t)
    >> gr.tf_summarize(
        sigma_cr_min=gr.min(DF.sigma_cr),
        sigma_cr_mean=gr.mean(DF.sigma_cr),
        sigma_cr_max=gr.max(DF.sigma_cr),
    )

    # Visualize
    >> gr.ggplot(gr.aes("t"))
    + gr.geom_hline(yintercept=300, color="grey", size=1.5)
    + gr.geom_segment(
        data=gr.df_make(
            t=0.0323,
            y=300-50,
            yend=300,
        ),
        mapping=gr.aes("t", "y", xend="t", yend="yend"),
        color="salmon",
    )
    + gr.geom_segment(
        data=gr.df_make(
            y=300 * 1.25,
            t=0.03,
            tend=0.0361,
        ),
        mapping=gr.aes("t", "y", xend="tend", yend="y"),
        color="blue",
    )
    + gr.geom_line(gr.aes(y="sigma_cr_min"), linetype="dashed")
    + gr.geom_line(gr.aes(y="sigma_cr_mean"))
    + gr.geom_line(gr.aes(y="sigma_cr_max"), linetype="dashed")

    + gr.coord_cartesian(
        xlim=(0.032, 0.033),
        ylim=(275, 325),
    )
    + gr.theme_minimal()
    + gr.labs(
        x="Plate Thickness (in)",
        y="Critical Buckling Stress (psi)"
    )
)
p.save("stang-q8-zoom.png")
p
/Users/zach/opt/anaconda3/envs/evc/lib/python3.9/site-packages/plotnine/ggplot.py:719: PlotnineWarning: Saving 6.4 x 4.8 in image.
/Users/zach/opt/anaconda3/envs/evc/lib/python3.9/site-packages/plotnine/ggplot.py:722: PlotnineWarning: Filename: stang-q8-zoom.png
<ggplot: (8766079311192)>